Introduction
West Africa produces large quantities of shea nuts and shea butter, although the exact production figures are not known (Abujaja et al., 2013). However, for the year 2008 alone, about 3.8 million tonnes of shea nuts were exported from West Africa (Issahaku et al., 2011). The main exporting countries in decreasing order are: Nigeria, Mali, Burkina Faso, Benin, and Niger. For general shea trade, Europe is currently a regular importer of shea nuts with annual import values fluctuating between 6,000 tonnes and 60,000 tonnes (Teklehaimanot, 2003). At the grass root level, shea nuts and shea butter exchange by indigenous people is often a secondary source of income available to raise the living standards of people (Maydell, 1983; Delabre et al., 1987).
Ghana has a comparative advantage in the production of shea nut over other countries because the shea tree (Vitellaria paradoxa) grown in that country mature early and produce better quality seeds (nuts) compared to its West African neighbours (NARP, 1993). This implies, the forgone
cost of Ghana in the production of shea nut is less compared to the forgone cost of other countries. Greater benefits can be driven from a comparative advantage if exploited properly, and critical studies or research could be conducted to reveal how increasing efficiency or adoption of improved technology could increase the net revenue from shea butter processing. Furthermore, shea butter processing and trading are major income generating activities that offer employment to rural women particularly. Development policies in the northern region of Ghana entail the use of shea butter extraction as a significant factor in poverty alleviation and food security. The nut’s role has also attracted the attention of the government of Ghana recently, which has led to the establishment of a division of the Cocoa Research Institute at Bole in the northern region to research into the development of cultivable species of the shea tree and other valuable species beneficial to the people (Aboyella, 2002). As a valuable economically-derived commodity, any measures taken to increase the total output of shea butter production will ultimately raise the income of shea butter producers. Subsequently everyone in the shea butter value chain would benefit from improved living standards; including shea butter consumers. This could contribute to an increase in national income (Pascal, 1978).
According to cocoa research institute of Ghana (CRIG) report which is undated from Issahaku et al. (2011), Shea seeds and shea butter have multiple uses both on the domestic and international scenes. Considering the use of shea in a domestic setting, shea nuts constitute an important source of affordable fat and oil for cooking different foods (Abbiw, 1990). Measurement of shea butter sales in domestic market are usually in loaves and sometime small calabashes as divided by retailers. Fluery (1981) estimated that families whose household sizes range between five to seven have a daily consumption of about 150 g of butter. Health wise, shea butter is used as a base for medicinal and cosmetic ointments, as a pomade, as a hair cream, and as an illuminant as well as key ingredient for drugs manufacturing companies and for soap production (Abbiw, 1990). In Ghana, traditionally, low quality butter and by-products of processed nuts are smeared on earthen walls of houses as a waterproofing to protect walls during the rainy season and some believe it controls room temperature during the dry, or harmattan, season (Fluery, 1981). Branches of shea trees are utilized in various ways which include, chewing it to cure disease and hilling of wounds. Also, the fruit’s pulp is edible and is said to have laxative properties. Shea trees’ leaves are used as medicine to treat stomach aches in children and may be hung in the doorway when a woman is in labour. The leaves of shea tree is also used for covering the dead prior to their burial. The tree’s roots and root bark are ground to a paste and administered orally to cure jaundice. Dalziel (1937) asserted that, the roots of an African shea tree can be mixed with tobacco to produce a poison used by the Jukun of northern Nigeria. Shea wood, is durable and is sometimes used to make tool handles and mortars and pestles. It is also used as fuel in most villages (Ampofo, 1983; Soladoye et al., 1989; Agbahungba and Depommier, 1989; Abbiw, 1990; Lovett and Haq, undated; Millee, undated).
The industrialisation of a country is highly influence by rural industries and agro-industrial growth is essential for achieving higher economic growth. Measuring the effectiveness and efficiency of such industries is crucial in determining their sustainability and profitability. For the industries to be sustainable, there is a need to identify the profit efficiency, profitability factors and the key challenges the shea butter industry is facing so as to recommend appropriate policies for implementation. In the developing world, most of the studies dwelled on examining technical efficiency (Issahaku et al., 2011). Without undermining the significance of technical efficiency, an improvement in allocative efficiency can also lead to greater production efficiency. This research intends to find out the profit efficiency, the determinants of profit efficiency, the net gain of each processor, and the challenges faced by producers of shea butter in the northern region of Ghana.
Literature on shea butter production
The shea nut involved in this study is the fruit that grows on the shea tree (Vitellaria paradoxa) of the northern region of Ghana. The shea tree is a sacred tree to many indigenous peoples of Sub-Saharan African countries. In these countries, the shea tree, with its many uses, has been known for centuries. Hence, the processing of the nut into a secondary commodity would be a new benefit of the shea nut. The distinguishing quality of the shea nut crop, compared to other crops, is that shea businesses are traditionally located in rural areas and that women-owned enterprises are dominant and generate additional sources of income for many families living in these rural areas. Many factors affect the yield of the shea tree, including physical factors like the weather, bush fires (natural and man-made), drought, caterpillar plagues, and pruning. In the long term, anthropogenic selection of the trees, their age, and re-growing influence shea nut yields (Akihisa et al., 2010). One of the main concerns expressed by various authors is the aging trend of shea trees in Ghana, which agronomists believe is a result of the shortening of fallow periods due to land pressure and population growth. If the need for money is high on the short term, shea trees will perhaps burnt for charcoal production by shea pickers or harvesters. Increasing shea tree nut yields might be an opportunity to increase income, however, one must consider that increased yield does not automatically lead to an increase in income without a parallel increase in demand.
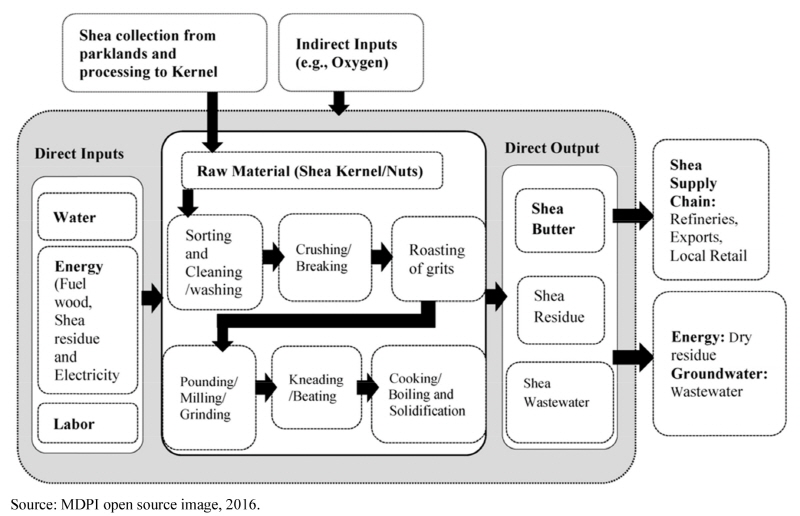
Processing shea nuts into shea butter involves many steps which start from waiting for the wild shea fruit to ripen, collection of wild fruit, extraction of kernel from fruit, washing, drying and sorting for quality of kernel, crushing of kernel, roasting of crushed kernel and milling of the roasted kernel into paste. At this stage, the decision will be taken either to extract the oil using a butter machine or by the manual method. More than 80% of the respondents in this research were using the manual method which commonly refers to ‘hand-made’ or ‘natural’ butter. Therefore, this research focussed on the hand-made or manual approach. After milling the roasted kernel into paste, water is added to the paste and kneaded to emulsify the oil. Next, the emulsion is boiled to eliminate water and sanitize the mixture. Next, the purified oil is strained to separate shea residue, usually called ‘by-product’. Finally, the oil is left to cool down and solidify. The last stage involves packaging the oil and selling it, either locally or internationally. The diagram below illustrates the method involved in the processing of shea butter.
Materials and Methods
Data set
The study covers selected districts in the northern region of Ghana because of the high level of processing and marketing of shea butter in the region. The northern region occupies an area of about 70,383 km2 and is the largest region in Ghana in terms of land area. The northern region is edged by the upper east and upper west regions to the north, Brong Ahafo and Volta regions to the south, and two neighbouring countries, the Republic of Togo to the east, and Côte d’Ivoire to the west. The soil types are savannah-ochrosols, which develop under rainfall averages between 800 mm and 1,500 mm. There are predominantly medium sandy loams in the upland and valley, respectively. This supports the germination of both wild and cultivated shea trees from which shea nut is derived and processed in to shea butter.
Data was collected from selected persons who engaged in the processing and selling of shea butter from various towns and villages within northern region of Ghana. Variables of consideration were the socio-economics characteristics of respondents, the cost and revenue associated to the production and marketing of shea butter and the challenges encountered in the shea butter industry. Data was collected, using a semi-structured questionnaire, from 120 shea butter processors and marketer from 8 different communities-namely Gesunaayili, Mbanaayili, Vitting, Yong, Savelugu, Sankpagla, Kaanfiehihyili, and Kpilo, all located in northern region of Ghana. Varied numbers were given to the different communities depending on the number of shea butter processors as some communities had few, while others had large numbers of them. The 120 questionnaires were completely answered enabling our analysis.
Empirical model
Stochastic profit frontier
Profit efficiency in the present study is defined as profit gain from operating on the profit frontier, considering shea butter prices and other identified factors. Considering a processor whose aim is to maximize profit subject to perfectly competitive input and output markets. The explicit Cobb-Douglas functional form for the shea butter processors and marketers in the study area is therefore specified as follows:
Where:  represents normalized profit computed as total revenue less variable cost divided by average shea butter price; LC represents average cost per man day of labour; PSN represents average price per bag of shea nut; PW represents average price for daily use of water; PWT represents average price of working tools, QSB represent quantity of shea butter produced (scale of production) and Z represents other operating costs. The inefficiency model (Ui) is defined by:
Where:  is the constant term or intercept and
  ,
,  , ……,
, ……,  , represent the parameters to be estimated.
The inefficiency model differs slightly from that of Ogbonnaya and Adgidizi (2008) by the introduction of other economic variables. The socio-economic variables are included in the model to indicate their possible influence on the profit efficiencies of the shea butter sellers (determinants of profit efficiency). The variance of the random errors, σ2v and that of the profit inefficiency effect σ2u and overall variance of the model σ2 are related thus:
This measures the total variation of profit from the frontier which can be attributed to profit inefficiency (Battese and Coelli, 1995). The log likelihood function estimates the gamma (λ) as:
The parameter λ represents the portion of inefficiency in the whole residual variance with values ranging between 0 and 1. A value of 1 suggests the existence of a deterministic frontier, whereas a value of 0 can be seen as evidence in the favour of Ordinary Least Square (OLS) estimation. All the parameter estimates of the stochastic frontier profit function and the inefficiency model were derived using the program Limited Dependent variables (LIMDEP). A three-step estimation method is used for obtaining the final maximum likelihood estimation (MLE). The MLE procedure uses the Davidon-Fletcher-Powell quasi-Newton algorithm. This research has adopted the two varied models where the final MLE was estimated. Model 1 is the traditional response function OLS in which the efficiency effects are not present (Ui = 0). It is a special form of the stochastic frontier production function model in which the aggregate variation of output, as a result of technical inefficiency, is zero; that is γ = 0. Model 2 is the MLE model where there is no restriction, and thus γ ≠ 0. The two models were compared for the presence of profit inefficiency effects using the gamma (γ) test of significance.
The following null hypothesis is tested using the gamma test: There is no inefficiency of profit (γ = 0) which means each shea butter processing plant is operating on the profit frontier.
Enterprise budgetary analysis
An enterprise budgetary analysis was done in order to know the net profit of the processors/marketers of shea butter. The cost and return in shea butter processing and marketing was estimated. According to Farayola et al. (2012) and Adegeye and Dittoh (1985), profit is defined as the net flow of income. This implies that the measurement of profit largely depends on what parameters are chosen to be used; in essence, profit indicates whether a business is worthwhile or not.
Benefit cost ratio and rate of return on investment were used to measure the profitability and to determine the worthwhileness of shea butter processors’ businesses.
Profit = Total Revenue - Total Cost
Mathematically,
Where: π denotes Profit; TR is Total Revenue (amount derived by selling units of product from the enterprise); TFC is Total Fixed Cost (spendings on fixed assets used in processing and marketing e.g. calabash, cooking pot) and TVC is the Total Variable Cost (cost incurred for processing and marketing shea butter e. g. cost of raw materials, transportation cost).
The Gross Margin (GM) equation is given as:
Where: GM = Gross Margin (in Ghana Cedi), Q = Quantity of shea butter processed (in kg), P = Price of processed shea butter (in Ghanaian Cedi).
Benefit cost ratio (BCR)
Another critical measure of profitability that was employed was BCR. The reason behind this was to elevate and confirm the profitability of each respondent of shea butter processors and marketers. The formula is stated as:
BCR = Total Revenue (Benefit) ÷ Total Cost.
As asserted by Issahaku et al. (2011) and Adegeye and Dittoh (1985), before a business can be termed a profitable venture, investment criteria require that BCR should be greater than one {BCR > 1}.
Rate of return on investment (ROI)
Rate of return on investment is another measure used to determine the worthwhileness of a business. Rate of Return = (TR - TC) / TC; by interpretation, the rate of return has a direct relation with net gain - the higher the rate of return of an investment, the more profitable the business is.
Kendall’s coefficient of concordance
Kendall’s coefficient of concordance was used to rank some of the challenges that processors and/sellers experienced in their dealing with the processing and selling of shea butter. Kendall’s W measures the extent of the agreements level among several respondents who have common characteristics of suffering a given set of n objectives (challenges) (Legendre, 2005). W is an index ratio of observed variance of the sum of ranks to the maximum possible variance of the ranks. The reason for the computation of the index is to find the ranks sum for each challenge being ranked. If there is a maximum agreement among the respondents` ranking, then the ranking is said to be perfect. Otherwise, there is variability within or among the ranks sum (Mattson, 1986). According to (Legendre, 2005), Kendall’s coefficient of concordance (W) is given by the relation:
Where: W denotes Kendall’s coefficient of concordance; P denotes number of respondents ranking the challenges, n denotes the number of quality perceptions. T denotes correction factor for tied ranks, S denotes sum of squares statistics over the row sum of ranks (Ri).
The sum of square statistics (S) is given as:
Where: Ri is row sums of rank and R is the mean of Ri
The correction factor for tied ranks (T) is also given as:
Where: t3 is the number of ranks in each of m group of ties
The test of significance of Kendall’s coefficient of concordance will be done using the chi-square statistic which is computed using the formula:
Where: n is the number of constraints, P is the number of persons interviewed and W is Kendall’s coefficient of concordance.
The null hypothesis for Kendall’s W is that, there is no agreement among respondents on the challenges faced, while the alternative holds that, there is at least some agreement among respondents. If the computed chi-square is greater than the tabulated chi-square, then the null hypothesis of zero must be rejected, paving the way for the research hypothesis. On the other hand, the alternative (research) hypothesis, that there is some level of agreement among the respondents in the ranking of the constraints, could not be rejected.
Results and Discussion
Descriptive statistics
Table 2 shows that 63.3% of the respondents are within the age range of 31 - 50 years. This is in concordance with the fact that people in this age range are the majority in the shea butter industry, being active in production and marketing and therefore capable of the tasks involved in the enterprise as they are of working age. On average, respondent were 33 years old. The shea butter industry also mostly consists of female-run enterprises as shown in the Table 2. Most of the respondents were female (77.5%), while males comprised only 22.5% of the respondents. This is in line with the findings of Abujaja et al. (2013) who concluded that most (over 90%) of the processors and marketers of shea butter were female. Table 2 further reveales that the respondents had various education s levels, with 71.7% having basic education- ending their studies in primary school, or senior or lower high school, either being former (where there is syllabus) or informal (where there is no syllabus). Another category of respondents (27.5%) had second cycle education, and only 0.8% had tertiary education. This indicates the low level of education among participants in the shea butter industry, which might be responsible for some of the challenges processors are faced with. These include; difficult in adopting new methods and other technologies to improve the quality of output and increase productivity.
Table 2 also shows that 66.7% of the respondents are married, 22.5% are single and 10.8% are divorced. The greater percentage of married persons in the processing of shea butter results from married processors benefiting from an access to cheaper labour in the form of their children and members of their marital home such as sister in-law as a source of labour. In addition, 75.8% of the respondent had 10 and below dependents; about 22.5% of them had 11 - 20 dependents while 1.7% of respondents had 20 and above dependents. As most of the respondants had low levels of education, families of small sizes was not the norm, which explains their larger percentages with reasonable family sizes. The results in Table 2 further show that a majority of respondents, 77.5%, have spent between 11 - 40 years in production and marketing of shea butter, while 2.5% have spent 40 and above years in the industry and the remaining 20.0% accounts for those respondents that have spent 10 and less years’ experience in the business. The fact that, most of the respondents have significant years of experience in the processing of shea butter, was inline with majority of them dropped from school at the tender age.
|
Table 2. Summary statistics of respondents’ socio-economics characteristics. 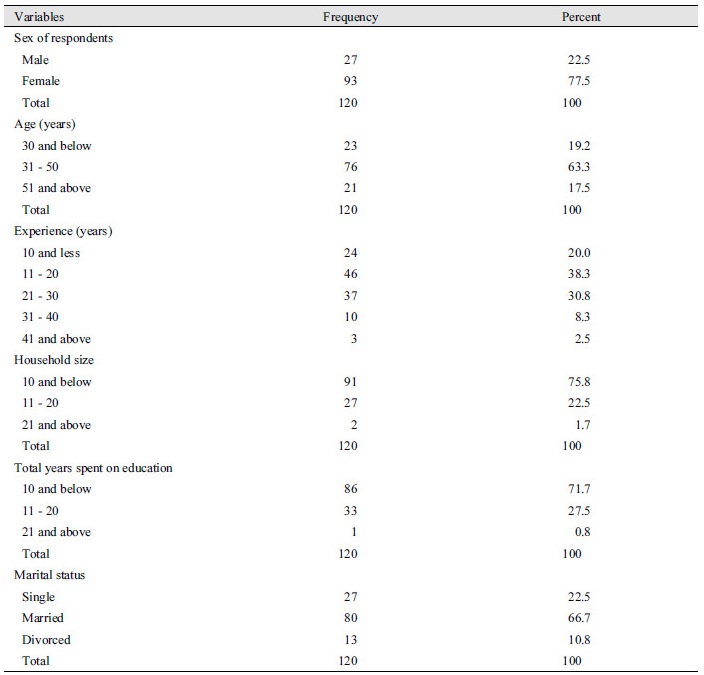
|
|
|
Source: Field survey, 2016. |
|
Stochastic profit frontier results
Maximum likelihood estimates of the parameters of the stochastic profit frontier
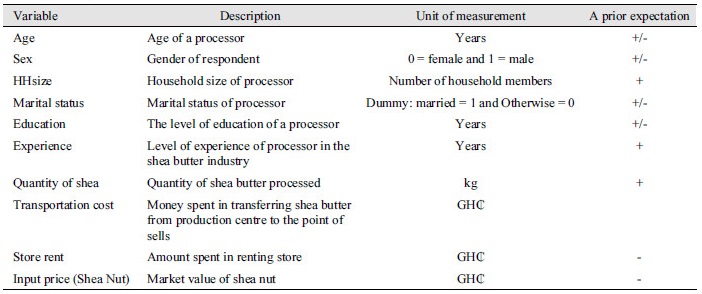
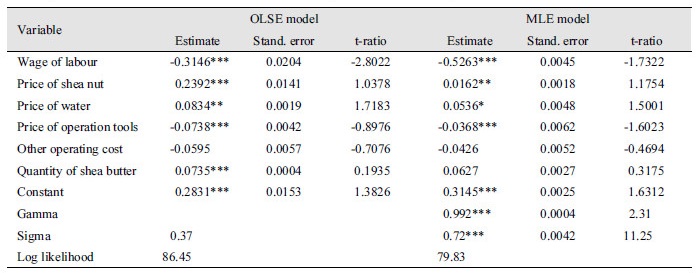
The maximum likelihood estimates (MLE) of the parameters of the stochastic profit frontier model are presented in Table 3. The Table 3 below shows cost per man day of labour, cost of operation tools, and cost of other operations, estimated coefficients of the parameters of the normalized profit function. The variables work on the assumption that, competitive markets are positive. The following variables: price of shea nut, price of water used, and quantity of shea butter produced, which characterise the size of the firm in the normalized profit model, have a positive coefficient. This indicate that as the values of these variables increase, the normalized profit of the farmer also increases. Whereas the variables that have negative signs show that, when such variables increase, the normalized profit of shea butter sellersdecrease.
Comparing the t-calculated value of 2.31 to the t-tabulated value of 1.960 led to the rejection of the null hypothesis (γ = 0) of no inefficiency of profit. The decision is that γ ≠ 0. This means that there was profit inefficiency among shea butter sellers in the study area as confirmed by the significance of the gamma (γ) estimate. The estimated gamma parameter (γ) of MLE model of 0.992 in Table 3 was highly significant at a 99 percent level of confidence. This implies that a one-sided random inefficiency component strongly outweighed measurement errors and other random disturbances. This means that about 99.2 percent of the variation in actual gains from profit frontier, which represents maximum profit among sellers, mainly arose from differences in sellers’ practices rather than random variability.
Determinants of profit efficiency of shea butter producers
The parameter estimates for determinants of profit efficiency using the stochastic Cobb Douglass profit function are presented in Table 4. However, a critical analysis of inefficiency models reveals that the positive and negative signs and significance of the estimated coefficient in the inefficiency model have a significant impact on the profit efficiency of the seller. Based on this, the variables in the inefficiency model which have negative coefficients, indicate that as these variables (sex, household size, marital status, educational level, transportation cost, store rent, and price of shea nut) increase, the profit efficiency of the seller increases, hence an increase in profit. While the positive variables (age, experience and shea butter quantity produce) have a negative impact on the profit efficiency of shea butter sellers in the study area. The positive coefficient of age in the present study is in agreement with the work of Abdulai and Huffman (1988) while the inverse coefficient of educational level is in conformity with Kumbhakar et al. (1991), Ali and Flin (1989), Abdulai and Huffman (1988), and Huffman (1974). The results from the stochastic profit frontier analysis have indicated that sellers’ profit efficiency was directly or positively influenced by sex, household size, marital status, educational level, transportation cost, store rent and price of shea nut. These findings have important policy implications in improving production efficiency among processors of shea butter in Ghana. Nevertheless, government should make it a priority to encourage both men and women to go into the processing of shea butter in an attempt to bridge the gap between genders in the industry. Ensuring the adoption of the machine approach to processing shea nuts and giving training and education to industry participants of the rural sector especially, given the current political and economic environment in Ghana. This will provide processors and sellers with the skills essential to increase profit efficiency. In conclusion, the result of this study has clearly shown that employing the stochastic profit frontier method paves the way for detailed analysis of the determinants of specific business efficiency.
|
Table 4. Maximum likelihood estimates of the profit inefficiency model. 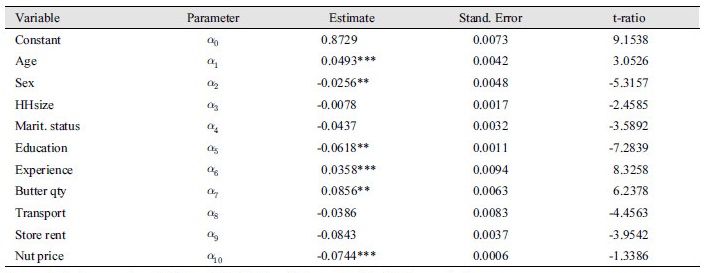
|
|
|
Source: Author’s computation of field data, 2016 ***, ** and * denote 1%, 5% and 10% respectively. |
|
An average 0.585 profit efficiency suggest that, considerable amount of profit is gained among shea butter processors in the sampled area. The inefficiency associated with controllable decisions is about 99.2%, hence government and Non-governmental organisations (NGOs) should educate sellers on how to reduce controllable inefficiency in their production of shea butter. The present study examined the performance of micro and small agribusinesses in northern region of Ghana. Objectives were set and included: assessing the profit efficiency of micro and small agribusinesses (shea butter producers and sellers), determining the factors that influence profit efficiency, finding investment opportunities, and assessing the challenges faced by the industry. The stochastic profit frontier analysis was used to assess the profit efficiency of processors.
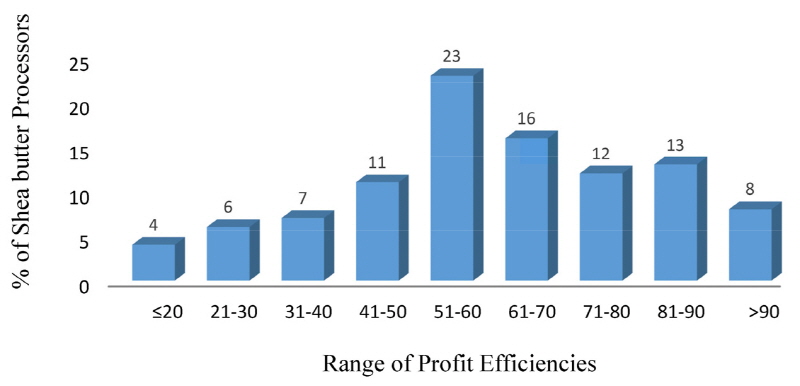
Determinants of profit efficiency among the small-scale shea butter processors were identified using stochastic Cobb-Douglas profit frontier model. The parameters estimated using the Cobb-Douglas profit frontier indicated that the majority of the factors have positive signs on the profitability of shea butter production in the northern region of Ghana. Profit efficiency distributions have shown that shea butter producers were fairly efficient in their resource allocation, judged by the fact that more than half of the producers have profit efficiencies of 60% and above. An average profit efficiency of 58.5% suggests that a considerable amount of profit is gained due to the relative level of efficiency observed in the sample area.
The research reveals that profit efficiency varies widely among producers, ranging from a minimum of 18.68% to a maximum of 99.48%. The wide variation can be associated with differences in efficient allocation and use of inputs among the butter producers. The mean estimated profit efficiency of 58.5% indicates that shea butter producers in the study areas can increase the scope of their profit by 41.5% by adopting available production techniques used by the most efficient producers or processors.
In Fig. 2, it is observed that the majority (23%) of shea butter producers have profit efficiency scores ranging from 51 to 60, followed by 16% of the producers having their profit efficiency score between 61 and 70. Out of the 120 producers, only 24% have their profit efficiency score ranging from 21 to 50. Fifty-one percent of the producers have their profit efficiency score ranging from 51 to 80. About 25% of shea butter producers have their scores ranging from 71 - 90. If the least efficient shea butter producer were to achieve the efficiency status of the most efficient shea butter producers, then that shea butter producer must reduce costs by 80.8%. On average, for a shea butter producer to achieve the optimal profit efficiency, he/she must reduce costs by 41.5%.
Cost and return analysis
Shea butter processors and marketers’ profitability was analysed using cost and return analysis. The total cost of each respondent was computed and total revenue was also estimated to determine the profitability of processing shea butter to the firm. From the result of the analysis, the annual total cost for the 120 respondents of shea butter processors and marketers was calculated. Total variable cost was easy to derive as it comprised the summation of all costs that change with respect to production, whiles fixed cost was estimated using straight-line depreciation method. The total revenue for each enterprise was estimated to be unit price of shea butter multiply by quantity sold in the year. Based on the figures of total cost and total revenue for the sample size, profit was calculated as:
π = TR - (TFC + TVC)= TR - TC= (12,965,670 - 9,573,340) = GH₵ 3,392,330
GM = TR - TVC= (12,965,670 - 8,653,980) = GH₵ 4,311,690
Investment analysis
Ascertaining the profit level of each respondents was critical. It called for investment analysis. The benefit cost ratio analysis and rate of return to Ghanaian cedi analysis were computed as illustrated in Table 5 below. On one hand, results in Table 5 indicate that 67.5% of the 120 respondents (processors and marketers of shea butter) operated above the breakeven point (> 1) - the cost of their production and marketing is less than their revenue from production. On the other hand, only 10.8% operated below the breakeven point (< 1) - meaning their cost of production and marketing exceeded the revenue from production. A percentage of 21.7% operated at breakeven point, that is, the producers’ net gain for engaging in shea butter production and marketing was zero. The investment analysis clearly shows that shea butter business in the northern region of Ghana is profitable since a majority of the respondents are earning supernormal profit.
Table 6 below shows the results of rate of return on investment (RRI) analysis, which provides the amount of profit that a respondent earned on every Ghanaian cedi. The results show that, a greater percentage (40%) of the respondents realized an average profit of between GHP10 (GH₵ 0.1) and GHP50 (GH₵ 0.5) inclusive as profit on every GH₵ 1 invested in processing and marketing of shea butter. Also, 30.8% realized profits between GHP60 (GH₵ 0.6) and GHP100 (GH₵ 1) on every GH₵ 1 invested, while 13.4% realized profits of more than GH₵ 1 on every GH₵ 1 investment made on shea butter processing. However, only 15.8% run the business at loss. By computation, 84.2% of the respondents earned abnormal profit and only 15.8% earned subnormal profit. This result is in conformity to the cost gain analysis which shows that, shea butter enterprise is an attractive business to investors.
Kendall’s coefficient of concordance
The results of Kendall’s coefficient of concordance are presented in Table 7. From the Table 7, it is evident that, poor quality input (shea nut) was considered and ranked as the most prioritised challenge with a mean rank of 1.02. The next most challenging factor to participants of shea butter processing and marketing was the use of outdated equipment for processing shea butter, which resulted in low productivity and sometime poor quality output; bearing a mean rank of 1.24. The difficulty to access loans to increase production was ranked as the third most prioritised challenge to the respondents with a mean rank of 2.14. Unsatisfactory output (shea butter) prices, high cost of input (shea nut), poor transportation network linking production centre to market, loss of output during processing, and high cost of storage were ranked as fourth, fifth, sixth, seventh, and eighth challenges, with mean ranks of 2.46, 2.87, 3.35, 3.63, and 3.87 respectively. High labour cost was considered as the least challenge with a mean rank of 4.07. Kendall’s coefficient (0.728) shows greater agreement among respondents in the ranking of challenges which is significant at a 99 percent confidence level or 1 % significance level as the significant values is 0.000.
Conclusion
Shea butter which is derived from shea nut has been identified as having both economic and health benefits. To mention a few, research findings show that, traditionally, shea butter reduces the appearance of fine lines, scars and stretch marks on skin and can ease a variety of skin irritations, such as psoriasis, eczema, and sunburn. According to Akihisa et al. (2010) and Prasad et al. (2009), shea butter has demonstrated anti-inflammatory properties, and also contains compounds recommended for the prevention of tumour development in a carcinogenesis test, a procedure in which cancer cells are grown in a culture dish.
Economically, the processing and marketing of shea butter forms an essential pillar of the rural cottage industry as the processors and marketers consider the net revenue derived from the enterprise as being sustainable since it enables participant meet their basic needs. Though, the earning from the production of shea butter is low and this is a fact because, low capital investment brings about low earnings. Production in the shea industry is low due to the employment of traditional equipment, packaging, high wood consumption and laborious which all connect to cost and time consuming.
Based on the results, the stochastic profit frontier analysis showed that shea butter producers’ profit efficiency was positively influenced by sex, household size, marital status, educational level, transportation cost, store rent and price of shea nut. This research has clearly shown that employing the stochastic profit frontier does not restrict detailed analysis of the determinants of specific business efficiency. The profit efficiency of 0.585 suggests that a considerable amount of profit is gained among shea butter producers in the sampled area. The inefficiency associated with controllable decisions is about 99.2%, hence government and NGOs should educate processors on how to reduce controllable inefficiency in their production.
Fundamentally, the computed profit from the shea butter processing and marketing activities reveals that people in the business are living far below the poverty line of $ 11,130 per year for one person or $ 14, 218 per year for a couple and $ 17, 374 per year for a family of three (Christian and Larry, 2011) compare with $ 370 per year in the 1990s (World Bank, 1990; Hauser and Pilgram, 1999) as computation of the net gain per person shows that, each respondent’s annual gain from the processing and marketing shea butter was $ 8,077, equivalent to GH₵ 28,270 using 2016 conversion rate (GH₵ 3.5 = $ 1).
Based on the findings of the present study, it is recommended for government to support processors by giving access to group or solidarity loans in the form of hire-purchase through which they can acquire the modern machinery. This will have the added benefit of enabling knowledge-sharing within the group. Indeed, newly developed methods of processing shea using modern machinery are available, however, the respondents did not adopt them due the high price. Alternatively, Non-governmental organisations can give the processor in kind loans, affordable and subsidized prices, or interest rates to increase production and reduce the stress associated with cruder methods. This will increase profit efficiency of producers, and hence, improve their net gain in the production of shea butter.
Also, cosmetic companies and others that use shea butter as a raw material can develop improved methods of preservation, packaging, and marketing for the product. This would make shea butter competitive in the world markets by reducing the odour of the product and enhancing butter colour without vital nutrient loss and quality reduction. This would go a long way to generate foreign exchange and improve the price given to processors. A bad odour and unattractive colour reduce the price of the product according to the respondents. Shea trees and their economic value are threatened by their alternate use as fuel-wood and charcoal; hence this should be prevented with rules and regulations. However, most efforts should be directed towards growing more of these trees to increase production of the seeds with the aim of reducing shea nut prices as this will have a positive impact on producers’ profit efficiency.


