Introduction
Brassica has evolved into diverse phenotypes while adapting to various environmental conditions, and the members of the family are widely grown around the world (Im et al., 2016). It is one of the major economic crops in Korea with an annual production of 54 billion won. Among Brassica, 6 species are cultivated as agriculture crops including three diploids, B. rapa (AA genome, 2n = 20), B. nigra (BB genome, 2n = 16), and B. oleracea (CC genome, 2n = 18); and three tetraploids, B. juncea (AB genome, 2n = 36), B. napus (AC genome, 2n = 38), and B. carinata (BC
genome, 2n = 34) (U, 1935).
Cabbage belongs to the C genome and has rich nutritional value. Glucosinolates (GSLs) are one of the major secondary metabolites that are highly recommended in the human diet (Park et al., 2017). It contains many physiologically active substances that exhibit antioxidant and anticancer properties (Fenwick et al., 1983; Van Poppel et al., 1999). Glucosinolates are widely found in cabbage, and cruciferous vegetables contain sulfur that imparts a distinctive, spicy flavor which is highly volatile in nature (Fenwick et al., 1983). Up to date, about 100 kinds of glucosinolates have been identified. Among them, 30 GSLs are known to have physiological roles (Fahey et al., 2001). Moreover, GSLs have been reported to inhibit the development of cancers of the digestive organs and lungs. Studies on the pharmacological role of sinigrin revealed that it has anti-cancer, antibacterial, antifungal, antioxidant, anti-inflammatory, and wound healing properties (Mazumder et al., 2016). Because of these pharmacological benefits on human health, there are many reports about GSLs mostly studied using the Arabidopsis plant model, (Wittstock and Halkier, 2002; Halkier and Gershenzon, 2006). But, there are relatively fewer studies done in Brassica oleracea. Sotelo et al. (2014) reported that the accumulation and profile of GSLs in plants are highly dependent on the genotype and the environmental and developmental stages, and identified the genetic regions based on the QTL approach in Broccoli (B. oleracea var. italica) and Chinese kale (B. oleracea var. alboglabra).
In this study, we tried to identify genomic regions related to glucosinolate contents in cabbage and to provide basic information for cabbage breeding to increase the important components, glucosinolates.
Materials and Methods
Plant materials
For linkage mapping, we used a total of 188 F2 cabbage plants derived from crossing two diverse cabbage inbred lines “747” (high-rich glucosinolates) and “748” (low glucosinolates). For phenotype analysis, we used a total of 73 F3 cabbage plants that were produced from self-pollination of the same F2 plant population. They were used for High- performance liquid chromatography (HPLC) analysis. After sowing 10 seeds, 4 seeds with similar growth condition were picked and transplanted in warehouse. A total of 73 lines with three biological individuals per line were analyzed with two technical replications. They were then collected and immediately frozen in liquid N2, and transferred to the freeze dryer. After freeze drying, all of the samples were ground to powder using a tissue lyser (QIAGEN Co. Germany). The fine powder was used for extraction of GSLs and subsequent HPLC analysis of glucosinolates.
Linkage map and QTL analysis
JoinMap version 4 (Stam, 1993) was used for the genetic map construction. Logarithm of the odds (LOD) scores of 4.0 - 6.0 were used to assign the markers to linkage groups (LGs), and Kosambi’s mapping function was used to convert the recombination value into the map distance (Kosambi et al., 1944). Composite interval mapping (CIM) function provided in Windows QTL Cartographer version 2.5 was used for QTL mapping of glucosinolates (Wang et al., 2012). To confirm the presence of a QTL, genome-wide threshold values (P = 0.05) were estimated from 1,000 permutations of trait data across all genetic intervals. Tests for the presence of a QTL were performed at 2-cM intervals using a 5-cM window and five background cofactors, which were selected by forward regression analysis (Li et al., 2013).
Pretreatment of sample for identification and quantification of glucosinolates
Fine leaf powder (0.1 g dry weight) was mixed with 70% methanol (HPLC grade). The mixture was vortexed and heated for 10 minutes at 70℃ in a water bath. Centrifugation was then carried out at 10,000 × g at 4℃ for 8 minutes and the supernatant was recovered. This procedure was repeated three times in total, and the resulting supernatant was centrifuged at 2,000 × g at 4℃ for 10 minutes. Separation was performed in DEAE-A25 region (GE Healthcare, USA) with 300 µL of ion exchange resin column, and 1.5 mL of 50 mM formic acid was flowed through the column. After the ion exchange resin was stabilized, all of the supernatant extracted was passed through the column. Then, 1 mL of distilled water was poured into the column, and 250 µL of sulfatase (PN # S9626-10 kU; Sigma Aldrich, USA) was added to the end of the ion exchange resin column to desulfoglucosinolate the glucosinolates present in the column. Thereafter, all the mobile phase in the column was recovered and 1 mL of distilled water was further flowed to recover the reaction product. After centrifugation again at 20,000 × g for 4 minutes at 4℃, impurities were removed and the sample was finally passed through a filter (PTFE, 13 mm, 0.2 µm; Advantec, USA).
Quantitative analysis using glucosinolates components by liquid chromatography
Glucosinolate contents were quantified by analysis using a liquid chromatography system (Waters 2489; Waters, USA) equipped with a reversed phase column (Kinetex 2.6 µm, C18 100A, 100 × 4.60 mm; Phenomenex, USA). The content of glucosinolates were determined according to the ISO 9167-1 (1992) method by measuring the absorbance at 229 nm using a standard sample using sinigrin hydrate (Sigma-Aldrich Co., USA).
Results
Identification and quantification of glucosinolates in the B. oleracea
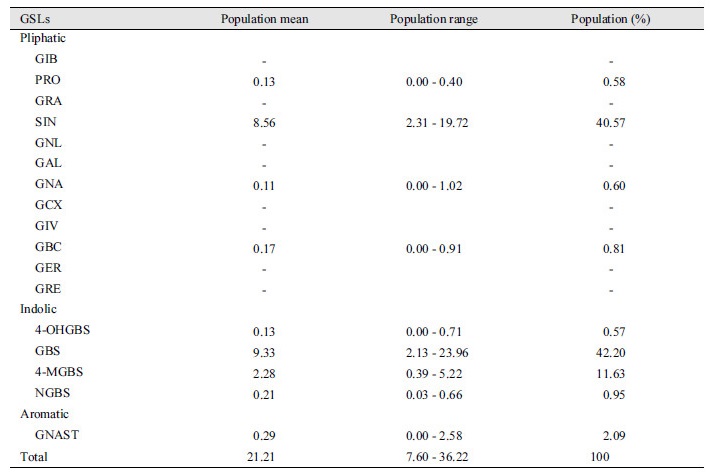
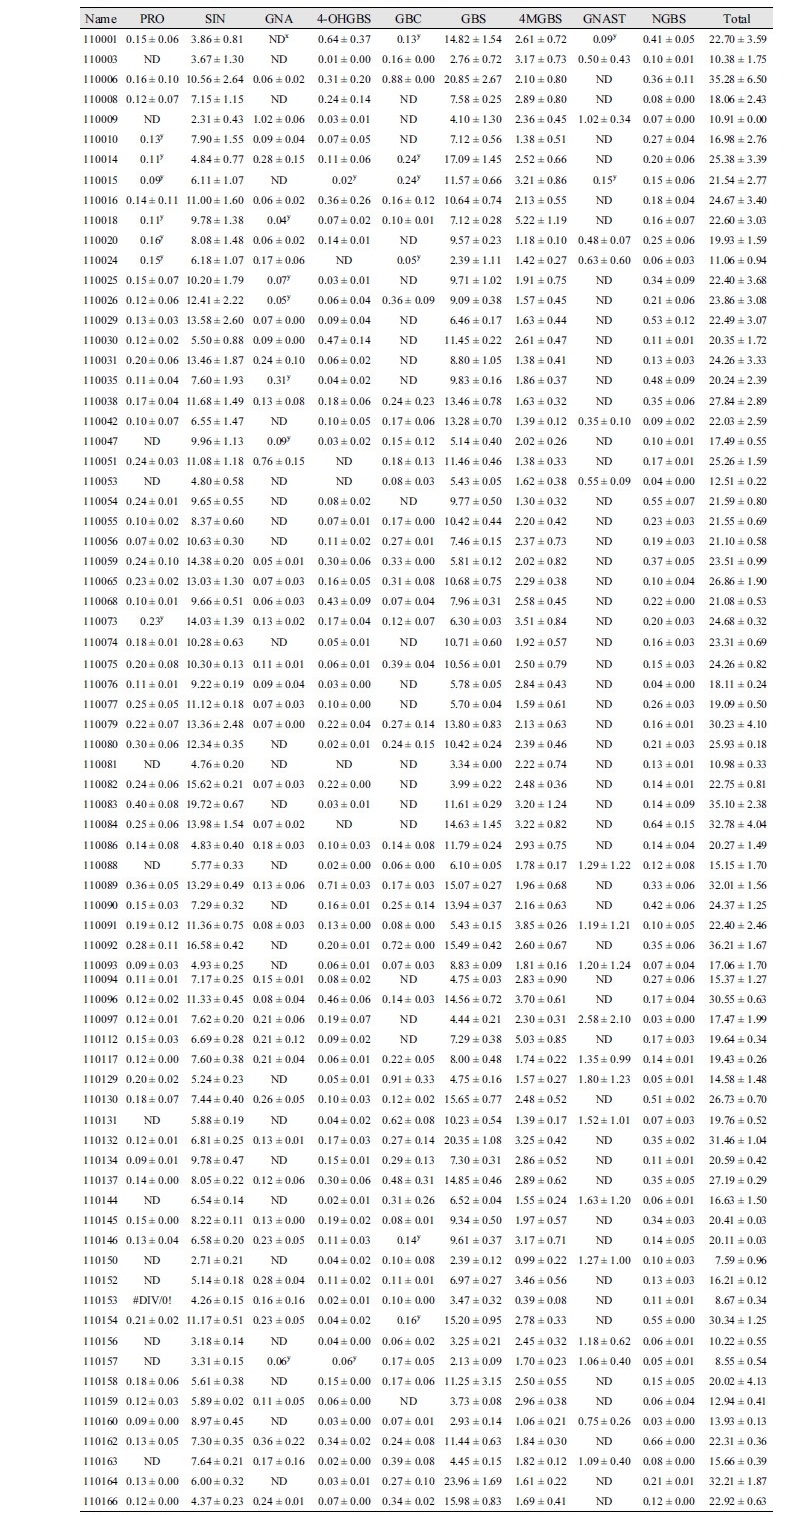
A total of 73 cabbages were analyzed by HPLC and nine GSLs were detected in this population (Supplementary Table 1). The detected glucosinolates can be classified into aliphatic, indole, and aromatic groups according to their function. Four GSLs were aliphatic; two of them belonging to the 3C group sinigrin (SIN) and gluconapin (GNA) and two of them belonging to the 4C group progoitirin (PRO) and glucobrassicanapin (GBC). Four indolic GSLs, 4-hydroxyglucobrassicin (4-OHGBS), glucobrassicin (GBS), 4-methoxyglucobrassicin (4-MGBS), and neoglucobrassicin (NGBS) and one aromatic GSL, gluconasturtiin (GNAST), were also detected (Table 1). The average content of total components was 21.21 µmol g-1/dw, the minimum value was 7.60 µmol g-1/dw, and the maximum value was 36.22 µmol g-1/dw. The main compounds were sinigrin at 40.57% of the total profile and glucobrassicin at 42.2% of the total profile with the two accounting for 82.77% and the remaining 17.23% for other components. The 4-methoxyglucobrassicin has an average content of 2.28 µmol g-1/dw (11.63% of total components), and the remaining components are in small amounts of less than 3% (Table 1).
|
Table 1. Glucosinolate (GSL) profiles and concentrations (μmol/g of DW) of mean and range of the F3 population of cabbage. 
|
Genetic map and QTL analysis using glucosinolates
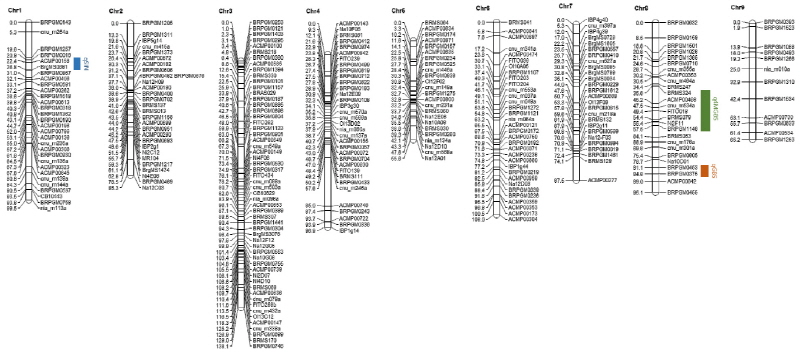
We analyzed QTL mapping based on the genetic linkage map as described in an earlier report (Pang et al., 2015). The map contains 270 genetic loci, and a total length of map was 830.9 cM with an average distance between loci of 3.6 cM.
Glucosinolate component variation in population was investigated in the samples grown in summer, 2015. To declare the presence of a QTL, genome-wide threshold values (P = 0.05) were estimated from 1,000 permutations of trait data across all genetic intervals.
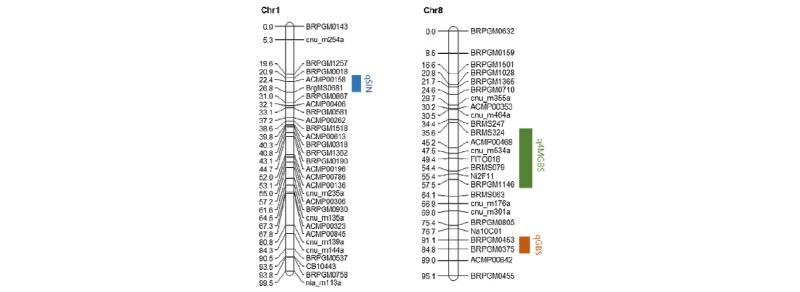
Three QTLs (qSIN, qGBS, q4MGBS) were detected for the components of sinigrin, glucobrassicin, and 4-methoxyglucobrassicin. Detected QTL regions were labeled with linkage map with rectangular bars (Fig. 1; Supplementary Fig. 1). qSIN was located at 26.8 cM on Chromosome 1 that has phenotypic variation of 29.50% and this QTL is located between markers ‘ACMP00158’ and ‘BrgMS0681’ with a marker interval of 22.4 - 26.8 cM. qGBS was located at 71.5 cM on Chromosome 8 that has 6.49% of phenotypic variation and this QTL was located between markers ‘ACMP00149’ and ‘Ni4F06’ with a marker interval of 35.6 - 37.5 cM. q4MGBS located at 49.4 cM on Chromosome 8 has shown 1.74% of phenotypic variation and this QTL is located between markers ‘BRMS324’ and ‘BRPGM1146’ with a marker interval of 35.6 - 57.5 cM (Table 2).
Discussion
Brassicaceae family is the fifth largest group in flowering plants that has been studied for long time, and it has recently become more popular due to its richness in glucosinolates (Johnston et al., 2005). Kushad et al. (1999) reported different types of glucosinolates with various levels depending on the type of cruciferous vegetables. Glucoraphanin content was high in broccoli. Brussels sprouts have high sinigrin and glucobrassicin. Sinigrin was a major glucosinolate component in cabbage, cauliflower, and kale. But, interestingly, the major glucosinolates in cabbage leaf materials were identified as aliphatic and indolic in our study. Sinigrin, which belongs to an aliphatic group, was 41%. Glucobrassicin and 4-methoxyglucobrassicin, which belongs to an indolic group, was 53.8%. As a result, the main component of cabbage was not only an aliphatic group but also an indolic group.
Glucosinolates are one of the important secondary metabolites that have pharmacological and anticancer effect on the human body (Kushad et al., 1999). In particular, a few studies have shown that sinigrin and glucobrassicin have anticancer, antimicrobial, antifungal, and antioxidant effects (Mazumder et al., 2016; Chen et al., 1996). Especially, glucobrassicin has been reported to be degraded to indole-3-carbinol by myrosinase and inhibit the activity of the T47D breast cancer cell line (Chen et al., 1996).
In this study, we obtained QTLs of qSIN, qGBS, and q4MGBS. qSIN was located in Chromosome 1 and the rest in Chromosome 8. A previous study by Sotelo et al. (2014) reported that sinigrin was found in Chromosome 5 and Chromosome 9. QTLs related to glucobrassicin were identified without Chromosome 8 in population ‘TO1000DH3’ that was derived from broccoli and chinese kale. In addition, 4-methoxyglucobrassicin was not found in ‘TO1000DH3’ population. Our QTLs results related to sinigrin, glucobrassicin, and 4-methoxyglucobrassicin have not been reported until now and were considered as novel QTLs.
Thus, our results indicate that the genomic regions that regulate glucosinolate contents are diverse and that the synthesis mechanisms might be different depending on the cabbage genotype. Hence, in a future study on Brassica oleracea, based on these results from the present study, we would like to scavenge the candidate genes that are located in these genomic regions. These results will provide essential information for breeding of cabbage with high glucosinolate contents, and our target is to develop component-specific markers for various glucosinolates.


