Comparison of the phenological characteristics of woody species in 2007 and 2018 at Daegu University Forest

Korean Journal of Agricultural Science
Su-Ho Lee1Yeong Dae Park1*

Abstract

This study examined the changes in plant phenology of 12 woody species in Daegu University Forest, Gyeongsan-si, Gyeongsanbuk-do in 2007 and 2018. The Hobo was installed at a height of 1.2 meters to measure the microclimate such as air temperature and relative humidity to identify its effects on the changes in plant phenology. The number of trees surveyed were 42 individuals that included 12 species in 9 families, all of which are deciduous broad-leaved trees. The trends in temperature change in 2018 were similar to that in 2007, except for the temperatures in the warmest and coldest month. Compared to 2007, the average temperature of the warmest month in 2018 was 2.5℃ higher, and the coldest month was 3.3℃ lower. The lowest temperature from February to April in 2018 had the highest correlation with the blooming dates of the trees (r = 0.692) in 2018, and the highest temperature showed the lowest correlation (r = 0.392). The blooming date by species was significantly different (p < 0.05). The blooming date of 8 species (75%), including Prunus padus, was earlier by 1 to 16 days, while 4 species, such as Prunus armeniaca var. ansu, was later by 1 to 7 days in 2018 than that in 2007. However, the flowering duration did not have a significant effect on the plant phenology. The results can be used as basic data for long-term monitoring of plant phenology in the future, and follow-up studies on other environmental factors and physiological factors are needed.

Keyword


Introduction

19세기 이후 산업사회의 발달은 산림의 심각한 훼손과 함께 과도한 화석연료의 사용을 가져왔다. 지구온난화는 해양보다 육지에서 더욱 심각하게 진행되었고, 기온상승은 북반구의 고위도로 갈수록 심하게 나타났다(IPCC, 2014). 한반도의 연평균기온은 지난 30년간 1.2℃ 상승했으며, 이러한 기온의 상승 경향(0.41℃/10년)은 전 세계적인 추세(0.13℃/10년) 보다 매우 빠르게 진행되고 있다(KMA, 2017).

최근 들어 지구온난화현상은 급진전하고 있으며, 산림생태계에도 많은 영향을 미쳐왔고(Lim et al., 2006), 기후변화로 인해 식물계절의 주기가 바뀌고 있음이 확인되었다(David et al., 2003; Jeong et al., 2013; Jeon et al., 2019). 구체적으로, 이런 기온의 상승은 꽃과 잎의 개화시기와 개엽시기 등 생물계절에 다양한 영향을 미쳤다(Ahas et al., 2002; Fitter and Fitter, 2002).

식물계절은 식물이 지역별 기후환경과 기후변화에 어떻게 반응하는지 확인하는 데 가장 민감한 자료 중 하나이다(Lee, 2011). 식물의 생육단계는 보통 개엽, 개화, 낙화, 낙엽 등의 단계로 구분되며(Kim et al., 2013; Lieth, 2014), 그 중 개화와 단풍은 봄과 가을을 대표하는 계절적 지표이다. 일반적으로 식물계절의 패턴이 빨라졌다는 반응은 봄에 가장 두드러지게 나타난다(Walther et al., 2002). 이처럼 수종별로 개엽, 개화, 단풍, 낙엽, 종자 산포 등의 식물계절 변화를 장기적으로 추적하는 것은 기후변화에 대한 산림생태계의 변화를 예측할 수 있는 가장 확실한 연구방법이다(Yim et al., 1983; Yim, 1986; Lee, 2011). 또한 식물계절주기에 대한 집중적 모니터링은 미래의 기후변화에 의해 생태계에 미칠 수 있는 부정적인 영향을 최소화하는데 반드시 필요한 연구이다(Choi et al., 2016).

국내 식물계절에 관한 연구는 한반도 식물계절 변화 경향과 기후변화 영향에 대한 연구(Lee et al., 2003; Lee et al., 2009)가 진행되고 있으며, 국립수목원을 중심으로 식물종 별 생물계절에 관한 연구(Kang et al., 2012; Kim et al., 2012)가 진행되었고, 기후변화 취약 산림식물종에 대한 연구(KNA, 2013, 2015)가 매년 보고서로 발간되고 있다. 또한 기후변화에 따른 봄꽃 개화시기의 변화를 모니터링하는 연구가 진행되고 있다(Lee et al., 2014).

국제적으로도 기후변화에 대한 식물계절의 변화 양상에 관한 연구(Piao et al., 2019)와 계절별 식물계절에 관한 연구(Amanda et al., 2015)등 다양한 식물계절 분야에서 지구온난화가 미치는 영향을 확인하기 위한 연구가 진행되고 있다.

이렇게 다양한 곳에서 식물계절에 대한 연구가 진행되고 있지만, 대부분 봄꽃 개화 시기에 관한 연구나 기후변화 취약종에 집중되어 있으며, 학술림에서 장기적으로 진행된 식물계절 연구는 아직 부족한 상황이다.

따라서, 본 연구는 대구대학교 학술림내 수목관찰원에서 낙엽활엽수 12종, 42개체들을 대상으로 2007년과 2018년에 관측한 개화일, 개화기간, 식물생육기간과 같은 식물계절 변화를 서로 비교하였으며, 온도 및 상대습도와 같은 미기상자료 분석을 통해 수종별 개화생리에 미치는 주요 환경인자를 확인하였다. 궁극적으로는 본 연구는 장기적으로 기후변화에 따른 수종별 식물계절 특성의 변화를 모니터링하기 위한 자료로 활용할 수 있을 것으로 기대된다.

Materials and Methods

조사지 개황

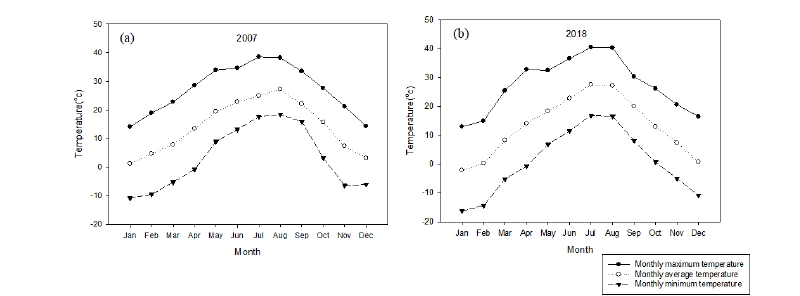
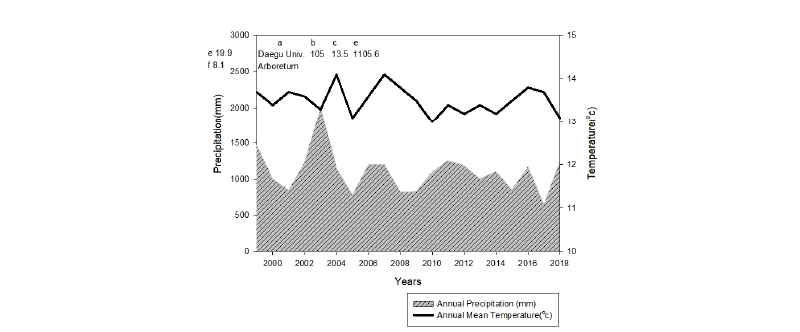
본 연구는 우리나라 온대 중부에 위치한 대구대학교 학술림내(면적 총 60 ha) 수목관찰원(면적 1.2 ha)에서 수행되었고, 행정구역상으로는 경북 경산시와 영천시 사이에 위치한다(북위 35°54′08″, 동경128°51′13). 최근 20년(1999 - 2018년)간 기상자료에 의하면, 평균기온은 13.5℃, 연평균강수량은 1,105.6 mm로 나타났다. 연평균기온은 과거 20년 전에 비해 약 0.6℃ 낮아졌으나, 최난월의 평균온도는 3.1℃ 높아졌고 최한월의 평균기온은 2.4℃ 더 낮아져서 월간 평균온도의 편차는 큰 변화가 있었다(Fig. 1).
http://dam.zipot.com:8080/sites/kjoas/images/N0030460311_image/Figure_kjoas_46_03_10_F1.jpg

Fig. 1. Climate diagram of Daegu University Forest in 1999-2018. Adapted from KMA (2019). a: Station name, b: Height above sea level(m), c: Annual mean air temperature(°C), d: Annual mean precipitation(mm), e: average of the maximum temperature (°C) from 1999 to 2018, f: average of the minimum temperature (°C) from 1999 to 2018, g: Average yearly of temperature, h: Annual precipitation (mm).

기상자료 수집

조사지내 산림미기상 측정을 위해, 간이 온/습도 로거(HOBO Pro V2 Temp/RH Date logger. Onset Computer corporation, Bourne, USA)를 수목의 흉고 높이에 방수장치와 함께 설치하여, 한 시간 간격으로 온도와 상대습도를 측정하였다. 2007년 기상자료는 부득이 조사지에서 가장 가깝게 위치한 기상청의 자동기상관측장비(AWS, Automatic Weather System, 35°54′45″,128°48′51″)의 기상자료를 활용하였다. 조사지 내 설치한 간이 온/습도 로거와 자동기상 관측장비의 2018년 관측한 온도를 비교한 결과, 시간별 온도 차는 최대 0.15℃ 이내로 큰 차이가 나지 않아, 본 연구에서는 두 기상자료를 서로 활용하여 비교하였다.

연구대상 수종 선정 및 관측

본 연구대상지는 과거 밀원식물에 대한 연구를 진행하면서, 2001년부터 2007년까지 개화 관측 자료를 보유하고 있다(Ryu, 2003; Ryu and Jang, 2003; Jang, 2009). 수목관찰원 내 식재 되어있는 수목 가운데 최소 종당 개체수가 3그루 이상이며, 과거 개화자료가 있는 9과 12종, 총 42개체를 선정하였다(Table 1). 조사종의 위치는 GPS 장비(Garmin Montana 650TK GPS, Taiwan)를 사용하여 모든 개체의 좌표를 기록한 후, 수종별 평균 값을 해당 조사종의 위치로 기록하였다.

조사종의 관측은 1일 1회 목측을 실시하였으며, 개체와 3 m 떨어진 곳에서 수관의 2/3 이상이 촬영 화면에 담기도록 촬영하여 식물계절 변화 촬영 이미지를 확보하였다.

수목의 동정과 학명, 국명은 국가식물표준목록(KNA, 2014)을 기준으로 작성하였다. 식물계절의 변화 단계는 Table 2와 같으며, 국립수목원의 기후변화 취약 산림 식물종 조사 매뉴얼의 식물계절변화 판정표를 활용하여 재구성하였다(KNA, 2013).

Table 1. The list of study species in phenology observation.

http://dam.zipot.com:8080/sites/kjoas/images/N0030460311_image/Table_kjoas_46_03_11_T1.jpg

Table 2. Guidelines for plant phenological observations.

http://dam.zipot.com:8080/sites/kjoas/images/N0030460311_image/Table_kjoas_46_03_11_T2.jpg

Modified from Korea National Arboretum (KMA), 2013: Manual of Conservation Project of Threatened Plants for Climate Change 2013.

통계분석

2007년과 2018년 개화자료를 비교하여 수종별 개화기간의 변화가 유의한 차이가 있는지를 알아보기 위해 분산분석(ANOVA)을 p < 0.05 유의수준에서 실시하였고, 개화와 온도인자의 관계를 파악하기 위해 평균온도, 최저온도, 최고온도를 인자로 하여 상관분석을 각각 실시하였다. 자료의 통계처리는 SPSS (statistical package for the social science, USA) 25.0 프로그램을 활용하여 처리하였다.

Results and Discussion

2007년과 2018년 미기상 비교

조사대상지의 2007년 연평균기온은 13.7℃, 2018년 연평균기온은 13.1℃로서, 지구온난화 추세와는 다르게, 연평균기온은 0.6℃ 낮게 나타났다. 그러나 최한월의 평균기온은 2007년 1.2℃, 2018년 - 2.1℃, 최난월의 평균기온이 2007년 26.2℃, 2018년 27.6℃로 겨울이 더 추워지고 여름도 더 더워지는 경향이 나타났고 이는 여타의 기후변화의 경향과도 일치하였다.

2007년 7월 27일 30.8℃로 가장 높은 일평균기온을 보였으며, 1월 13일이 - 3.2℃로 가장 낮은 일평균기온을 보였다. 2018년의 경우 7월 26일 32.4℃로 가장 높은 일평균기온을 나타냈으며, 1월 24일 - 10.1℃로 가장 낮은 일평균기온을 나타냈다(Fig. 2).

2007년 1월에서 3월 사이의 평균기온은 4.5℃로서, 같은 기간 2018년의 평균 기온보다 2.3℃높았다. 같은 기간 일평균기온이 0℃이하를 기록했던 날은 16일과 30일로 각각 나타났다.

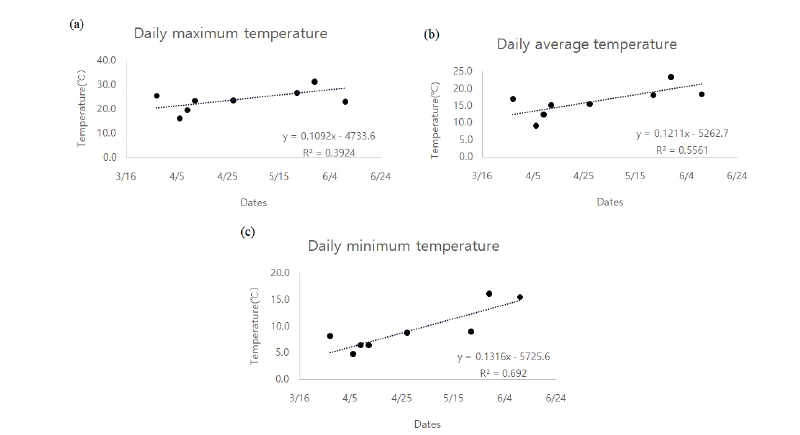
목본식물의 계절현상은 이른 봄 0 - 5℃사이의 기온변화에 가장 민감하게 반응하는 것으로 알려져 있으며(Min et al., 2007), 개화에 있어 일반적으로 온도, 수분, 광조건 등이 주요 요인이며, 특히 2월과 4월 사이의 기온이 가장 민감한 요인으로 알려져 있다(Chmielewski et al., 2004; Caroline and Richard, 2011). 본 연구를 통해서도 온도가 개화에 영향을 주고 있음이 나타났고, 이 중 개화에 일최저온도가 가장 큰 상관관계가 있음을 확인하였으며(r = 0.692), 일평균온도(r = 0.556), 일최고온도(r = 0.392)순으로 나타났다(Fig. 3).

따라서, 향후 장기적으로 개화일을 예측할 때에는 평균온도 보다 최저온도의 변화를 모니터링하는 것이 필요하다고 본 연구를 통해 나타났다.

http://dam.zipot.com:8080/sites/kjoas/images/N0030460311_image/Figure_kjoas_46_03_10_F2.jpg

Fig. 2. The monthly temperature of study site in 2007(a) and 2018(b).

http://dam.zipot.com:8080/sites/kjoas/images/N0030460311_image/Figure_kjoas_46_03_10_F3.jpg

Fig. 3. Correlation between temperature factors and blooming date. (a): the maximum temperature, (b): the average temperature, (c): the minimum temperature.

수종별 2007년 개화일과 2018년 개화일 비교

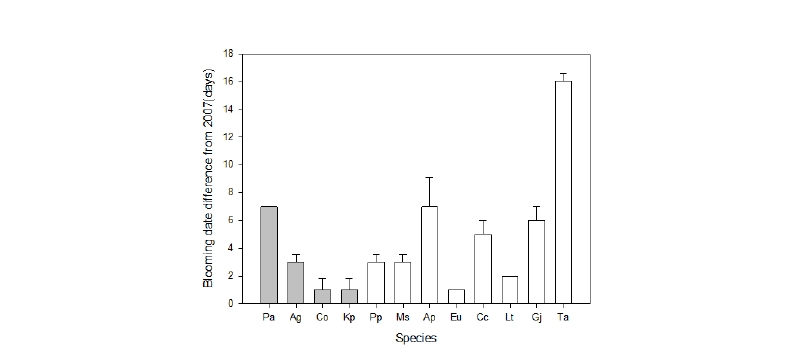
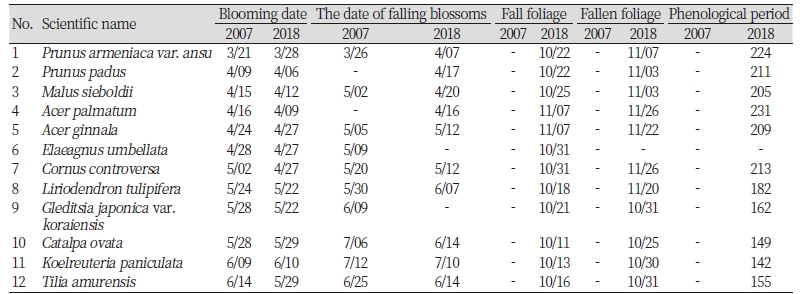
당초 지구온난화로 인해 모든 조사대상 수종의 개화시기가 2007년 대비 2018년에는 빨라질 것으로 예상했으나, 본 연구에서는 12종 중 귀룽나무(Prunus padus), 아그배나무(Malus sieboldii), 단풍나무(Acer palmatem), 보리수나무(Elaeagnus umbellate), 층층나무(Cornus controversa), 백합나무(Liriodendron tulipifera), 주엽나무(Gleditsia japonica var. koraiensis), 피나무(Tilia amurensis) 등 8종(75%)은 평균 5.3일 빨리 개화했으며, 살구나무(Prunus armeniaca var. ansu), 신나무(Acer ginnala), 개오동나무(Catalpa ovata), 모감주나무(Koelreuteria paniculate) 등 4종(25%)은 오히려 평균 3일 개화일이 늦어졌다(Table 3).

특히 피나무의 경우 약 16일 일찍 개화한 것으로 나타나 조사대상 수종 중 조사기간 동안의 환경 변화에 가장 민감하여, 눈에 띄는 개화일 차이를 보인 것으로 판단되었다. 개체간 개화일 편차를 분산분석을 실시하였는데, 분석 결과 개화일이 빨라진 수종과, 늦어진 수종 모두 개체간 차이가 유의하게 나타났다(p < 0.05; Fig 4).

이런 결과는 수종간 기후변화에 따른 영향 및 반응의 차이를 보여주고 있으며, 개체별 기온변화에 대한 민감함을 확인하는 것도 중요하다는 것을 보여주고 있다. 또한 개화일 변화 경향을 파악하기 위해서는 장기간의 자료가 필요할 것으로 판단되며(Julien and Sobrino, 2009), 개화일의 변화는 지역의 생물다양성에 영향을 미칠 뿐만 아니라 생태계 먹이사슬에도 영향을 줄 수 있다(Kong, 2012).

Table 3. Comparison of plant phenological cycle of 12 woody species between 2007 and 2018 at Daegu UniversityArboretum.
http://dam.zipot.com:8080/sites/kjoas/images/N0030460311_image/Table_kjoas_46_03_11_T3.jpg

‘–’ means no observation.

http://dam.zipot.com:8080/sites/kjoas/images/N0030460311_image/Figure_kjoas_46_03_10_F4.jpg

Fig. 4. Deviation of individual blooming date and species blooming date in 2018. Means with significantly different at p > 0.05 (p = 0.214), with are testified with one ANOVA test. (Values are mean S.D., n = 3). Gray bars are species that haves a later blooming date than that in 2007, White bars haves a faster than in 2007.

수종별 2007년과 2018년 개화기간의 비교

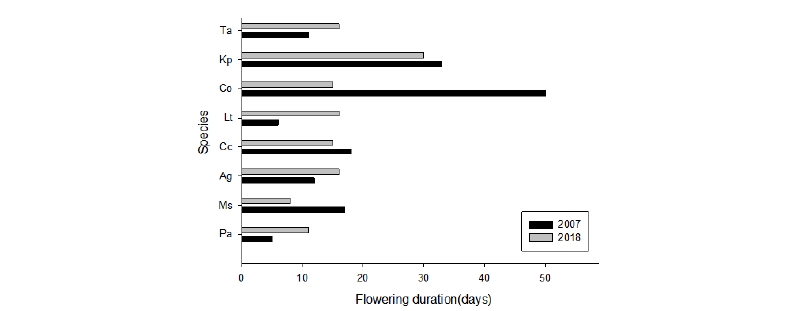
개오동나무의 낙화가 2007년에 비해 20일 이상 빨라져 2007년 40일에서, 2018년 17일로 개화 기간이 23일 줄어들었으며, 아그배나무와 모감주나무, 층층나무도 개화기간이 3 - 6일 단축되었다. 봄철 낙화에는 3월과 4월의 온도가 영향을 미치는 것으로 알려져 있다(Kim et al., 2012). 수종별 개화기간은 Fig. 5와 같으며, 이는 바람과 강우와 같은 환경적 요인도 있지만 기후변화에 따른 생리적 변화에 따른 것으로도 보여 앞으로 지속적인 모니터링이 요구된다.

http://dam.zipot.com:8080/sites/kjoas/images/N0030460311_image/Figure_kjoas_46_03_10_F5.jpg

Fig. 5. Comparison on flowering duration in 2007 and 2018. 4 species that were excluded were excluded due to the lack of data for 2007 or 2018.

수종별 식물생육기간 변화

식물의 생육이 시작되는 일평균기온이 5℃ 초과하는 날이 5일 이상 지속되는 기간의 첫날을 비교하면 2007년은 2월 6일, 2018년은 3월 10일로 오히려 한 달 이상 식물 생육이 늦어진 것으로 나타났다. 생육후기 평균기온이 5℃ 이하로 떨어지는 시기는 2007년 11월 18일이었고, 2018년은 11월 22일로 나타났다. 이처럼 생육가능 기간은 기후변화의 지표로서 활용이 가능한데(Seo et al., 2015), 최근 20년간 남부내륙지역의 식물생육 가능기간인 271일보다 2007년의 경우 약 2주정도 더 긴 생육기간을 보였으며, 2018년의 경우 약 2주 짧은 생육기간을 나타냈다.

개엽에서 낙엽까지 수종별 식물계절주기도 수종별로 다양하게 나타났으며(Table 3), 개화 기간과 수종별 식물계절주기의 상관관계를 분석하였으나, 관계가 없는 것으로 나타났다(p > 0.05).

낙엽과 단풍 등 잎과 관련한 식물계절 현상은 토양과 온도 등 다양한 요인이 작용한다(Lechowicz, 1995). 일반적으로 낙엽과 단풍에 영향을 주는 요인은 9월 평균기온과 8월의 강수량으로 알려져 있다(Jin et al., 2017). 단풍나무와 신나무를 제외하고 모두 10월에 단풍이 시작되었다. 2018년 9월의 평균기온이 20.1℃로 2007년에 비해 2℃ 더 낮기 때문에 2007년에 비해 단풍이 일찍 시작되었을 것으로 판단된다.

이렇듯 식물계절주기의 변화는 생태계를 구성하고 있는 생물종 사이의 생물계절 불일치 현상을 초래하여 먹이사슬 구조의 변화를 일으켜 생태계 불균형을 가져올 수 있다(Both et al., 2006; Jo and Ahn, 2008; Jones and Cresswell, 2010).

Conclusion

본 연구에서는 2007년에 비해 2018년의 평균기온이 0.6℃ 낮았으나, 최난월과 최한월의 기온편차는 더욱 커진 것으로 나타나, 앞으로 평균온도뿐 아니라 최고온도와 최저온도에 대한 모니터링이 더욱 중요할 것으로 판단되었다. 실제, 2018년 개화일과 최저온도와의 상관관계가 가장 높게 나타났다(r = 0.692).

조사대상 12수종의 개화일을 2007년과 비교한 결과, 8종(75%)은 개화가 1 - 16일 빨라졌으며, 4종(25%)은 개화가 오히려 1 - 7일 늦어진 것으로 나타나, 기온변화에 대한 개화일의 변화가 수종별로 다양하게 나타났다(p < 0.05).

봄에 잎 보다 꽃이 먼저 피는 살구나무의 개화는 1주일 늦어졌으며, 피나무는 조사대상 중 가장 빠르게, 약 16일 빨라진 5월 29일에 개화하였다.

개화기간은 생리적 요인과 환경적 요인에 영향을 받는데, 2007년에 비해 2018년에서 높은 3월과 4월의 평균기온과 잦은 강우로 인해 꽃의 발육이 충실하지 못하였고, 이에따라 낙화 시기가 빨라져서, 아그배나무 등 8종의 개화기간이 단축되었던 것으로 판단된다.

단풍과 낙엽의 경우 9월의 평균기온이 2℃ 더 낮음으로서 2018년의 단풍이 더 빨리 시작되었을 것으로 판단되었고, 낙엽의 경우 2018년 10월의 기온이 2007년에 비해 2.7℃ 낮은 평균온도를 보이고 있기에 2007년보다 더 빨리 진행되었을 것으로 판단된다.

조사대상 수종 가운데 살구나무가 224일로 가장 긴 생물계절주기를 보였으며, 모감주나무의 생물계절주기가 142일로 가장 짧았다. 생육기간의 경우 최근 20년 남부내륙지역 생육가능 기간보다 약 2주 짧은 258일을 보였다.

다양한 환경요인과 수목의 생리적 요인이 복합적으로 작용하여 나타나고 장기간 모니터링을 요구하는 식물계절연구에서 특정 년의 자료로 식물계절을 설명하는 것에 대한 한계점은 있지만, 그럼에도 본 연구는 2007년과 2018년 자료 비교를 통해 식물계절의 변화를 확인할 수 있었고, 수종의 개화 60일 이전부터 최저기온이 개화에 가장 큰 영향을 미친다는 것을 확인할 수 있었다.

따라서 후속 연구에서는 평균 온도 보다 개화 이전 월 최저온도의 변화를 모니터링하여 보다 개화시기를 정확히 예측할 수 있는지를 검토하는 연구가 필요하다고 판단된다. 또한, 미기상에 대한 수종별 감수성이 모두 다른 만큼, 수종별로 생육기간의 변화를 보다 장기적으로 관측하는 연구가 필요하다고 판단되었다.

Authors Information

Yeong Dae PARK, https://orcid.org/0000-0003-3021-5785

SuHo Lee, https://orcid.org/0000-0002-3810-9832

References

1  Ahas R, Aasa A, Menzel A, Fedotova VG, Scheifinger H. 2002. Changes in European spring phenology. International Journal of Climatology 22:1727-1738.  

2  Amanda SG, Richard BP, David LW. 2015. Autumn, the neglected season in climate change research. Trends in Ecology & Evolution 30:169-176.  

3  Both C, Bouwhuis S, Lessells CM, Visser ME. 2006. Climate change and population decline in a long-distancce migratory bird. Nature 441:81-83.  

4  Caroline AP, Richard BP. 2011. Leaf-out phenology of temperate woody plants: From trees to ecosystems. New Phytologist 191:926-941.  

5  Chmielewski FM, Müller A, Bruns E. 2004. Climate changes and trends in phenology of fruit trees and field crops in Germany, 1961-2000. Agricultural and Forest Meteorology 121:69-78.  

6  Choi CH, Jung SG, Park KH. 2016. Analyzing relationship between satellite-based plant phenology and temperature. Journal of the Korean Association of Geographic Information Studies 19:30-42. [in Korean]  

7  David G, Douglas GG, Raymond CS. 2003. Climate variability and ecosystem response at long-term ecological research sites. Oxford University Press, United Kingdom.  

8  Fitter AH, Fitter RS. 2002. Rapid changes in flowering time in British plants. Science 296:1689-1691.  

9  IPCC (Intergovernmental Panel on Climate Change). 2014. Climate change 2014. Synthesis Report. Contribution of Working Groups I, II, and III to the fifth assessment report of the Intergovernmental Panel on Climate Change. p. 151. IPCC, Geneva, Switzerland.  

10  Jang JW. 2009. A study on honey plants in Korea-the kind of honey plants in Korea and around a former scanning electron microscope form structure of the pollen. Ph. D. dissertation, Daegu Univ., Gyeongsan, Korea. [in Korean]  

11  Jeon MG, Nam WH, Hong EM, Hwang S, Ok J, Cho H, Han KH, Jung KH, Zhang YS, Hong SY. 2019. Comparison of reference evapotranspiration estimation methods under limited data in South Korea. Korean Journal of Agricultural Science 46:137-149.  

12  Jeong SJ, Ho CH, Choi SD, Kim JW, Lee EJ, Gim HJ. 2013. Satellite data-based phenological evaluation of the nationwide reforestation of South Korea. PloS One 8:e58900.  

13  Jin HG, Kim SW, Kim YK. 2017. A spatial prediction for the flowering and autumnal dates in Korea. The Korean Journal of Applied Statistics 30:417-426. [in Korean]  

14  Jo HK, Ahn TW. 2008. Differences in phenological phases of plants subsequent to microclimate change. Korean Journal of Environment and Ecology 22:221-229. [in Korean]  

15  Jones T, Cresswell W. 2010. The phenology mismatch hypothesis: Are declines of migrant birds linked to uneven global climate change. Journal of Animal Ecology 79:98-108.  

16  Julien Y, Sobrino JA. 2009. Global land surface phenology trends from GIMMS database. International Journal of Remote Sensing 30:3495-3513.  

17  Kang SK, Kim BD, Shin HT, Park KH, Yi MH, Yoon JW, Sung JW, Kim GS. 2012. The plants for phenology of the Mt. Juwang National Park. Journal of Forest and Environmental Science 28:247-253. [in Korean]  

18  Kim BD, Yu ST, Shin HT, Yi MH, Yoon JW, Kim GS, Sung JW. 2012. A study on the plants for phenology of the Mt. Palgongsan Provincial Park. Journal of Korean Nature 5:287-292.  

19  Kim JH, Lee EJ, Yun JI. 2013. Prediction of blooming dates of spring flowers by using digital temperature forecasts and phenology models. Korean Journal of Agricultural and Forest Meteorology 15:40-49. [in Korean]  

20  KMA (Korea Meteorological Administration). 2017. Climate change outlook report on the Korean Peninsula in preparation for the new climate regime. p. 156. KMA, Seoul, Korea. [in Korean]  

21  KMA (Korea Meteorological Administration). 2019. Weather data open portal. Accessed in http://date.kma.go.kr/ on 7 May 2019. [in Korean]  

22  KNA (Korea National Arboretum). 2013. Manual of conservation project of threatened plants for climate change. p. 243. KMA, Seoul, Korea. [in Korean]  

23  KNA (Korea National Arboretum). 2014. Korea plant names index committee. Accessed in http://www.nature.go.kr/ on 11 May 2019. [in Korean]  

24  KNA (Korea National Arboretum). 2015. Report of conservation project of threatened plants for climate change 2015. p. 1216. KNA, Seoul, Korea. [in Korean]  

25  Kong WS. 2012. 41 Keywords on climate change and ecosystems. p. 239. Geobook, Seoul, Korea. [in Korean]  

26  Lechowicz MJ. 1995. Seasonality of flowering and fruiting in temperature forest trees. Canadian Journal of Botany 73:175-182.  

27  Lee HS, Kim JH, Yun JL. 2014. Recent trends in blooming dates of spring flowers and the observed disturbance in 2014. Korean Journal of Agricultural and Forest Meteorology 16:396-402. [in Korean]  

28  Lee KJ. 2011. Tree physiology. Seoul National University Press, Seoul, Korea. [in Korean]  

29  Lee KM, Kwon WT, Lee SH. 2009. A study on plant phenological trends in South Korea. Journal of The Korean Association of Regional Geographers 15:337-350. [in Korean]  

30  Lieth H. 2014. Phenology and seasonality Modeling. p. 444. Springer, New York, USA.  

31  Lim JH, Shin JH, Lee DK, Suh SJ. 2006. Climate change impacts on forest ecosystems: Research status and challenges in Korea. Korean Journal of Agricultural and Forest Meteorology 8:199-207.  

32  Min BM, Yi DH, Jeong SJ. 2007. Relationship between phenological stages and calculative air temperature in spring time at Namsan. Journal of Ecology and field biology 30:143-149.  

33  Piao S, Liu Q, Chen A, Janssens IA, Fu Y, Dai J, Liu L, Shen M, Zhu X. 2019. Plant phenology and global climate change: Current progresses and challenges. Global Change Biology 25:1922-1940.  

34  Ryu JB. 2003. Year-round honey production by establishing honey plant plantations. Journal of Apiculture 18:109-116. [in Korean]  

35  Ryu JB, Jang JW. 2003. Studies on foraging activity of honey bees at flowers of Cornus officinalis and Prunus mume . Journal of Apiculture 18:1-4. [in Korean]  

36  Seo DJ, Jung HR, Kang JW, Hong YP, Kim HC, Moon HS, Chea YG, Kim YJ, Kim MY, Kim JK. 2015. A study on phenology of Pinus densiflora in the Baekdudaegan area. Journal of Agriculture & Life Science 49:121-132. [in Korean]  

37  Walther GR, Post E, Convey P, Menzel A, Parmesan C, Beebee TJC, Fromentin JM, Hoegh-Guldberg O, Bairlein F. 2002. Ecological responses to recent climate change. Nature 416:389-395.  

38  Yim YJ, Rim MK, Shim JK. 1983. The thermal climate and phenology in Korea. Korea Journal of Botany 26:101-117. [in Korean]  

39  Yim YJ. 1986. The effects of thermal climate on the flowering dates of plants in South Korea-for the exploitation of honey and pollen resources plants. Korean Journal of Apiculture 1:67-84.