Introduction
Plants absolutely require essential mineral elements, which are divided into macro (N, P, K, Ca, Mg, and S) and micro (Cu, Zn, Fe, Mn, B, Mo, Cl. and Ni), to complete their life cycle (Marschner, 2011). Despite of lower concerning compared to macro elements in terms of an importance in plant metabolism, micro elements have irreplaceable roles; energy production, primary and secondary metabolism, cell development, gene expression, hormone perception and signal transduction (Hänsch and Mendel, 2009). On the other hand, excessive or deficient condition of micro elements such as copper (Cu), iron (Fe) and manganese (Mn) can lead to heavy metal stresses causing limited enzyme activation, cellular oxidation and metabolic perturbation (Sharma and Dietz, 2009). Plant adaptation to mineral element deficiency closely involves different metabolic modifications occurring at different plant organs such as leaves, roots and fruits. Metabolomics which is a useful tool to comprehensively understand metabolic networks from the cell to whole plant level are broadly applied in physiological study. A significant increase in primary metabolites by Fe deficiency were reported from tomato (Rellán-Álvarez et al., 2011) and soybean (Chu et al., 2019). Rice plant resulted to opposite response to Zn deficiency; an increase in carbohydrates and a decrease in TCA intermediates (Rose et al., 2012). Mn deficiency, which is closely involved in photosystem II, chlorophyll and carbohydrate metabolism, led to a very serious effect on soluble carbohydrates (Millaleo et al., 2010). In boron (B)-deficient orange plants (Citrus sinensis), several carbohydrates and amino acids were accumulated whereas several organic acids remained constant or lower levels (Liu et al., 2015). From the previous study, a majority of primary metabolites were down-accumulated by micro element deficiency in cabbage plant (Sung, 2020).
The objective of this study was to test the hypothesis that bell pepper plants could regulate metabolic process and network to ensure the survival against unfavorable nutritional environments although the response might be different from the type of microelements. To achieve this goal, metabolite profiles from the leaves and roots of bell pepper plants grown in 1/10-strength of optimal micro element dose were obtained using GC-TOFMS. Relevant changes were assessed using metabolite response ratios and multivariate analysis was used to examine metabolite associations.
Materials and Methods
Plant materials and growth conditions
Seeds of bell pepper (Capsicum annuum L. cv. angulosum) were germinated on perlite supplied with de-ionized water. Uniformly grown seedlings (2nd leaf stage) were transplanted into hydroponic containers containing 1/2-strength Hoagland solution and grown for an additional 2 weeks prior to mineral treatment. Environmental conditions for the growth of bell pepper plants were set up as follows; 25 ± 3℃ (day time) and 15 ± 3℃ (night time), 800 - 1,200 μmol·m-2·s-1 of photosynthetic photon flux density (PPFD) during day time, and the replacement of nutrient solution at every 3 day. Standard nutrient solution (expressed as a Normal in the text) was composed of as follows: 2.5 mM Ca(NO3)2, 2.5 mM KNO3, 1 mM MgSO4, 0.25 mM KH2PO4, 0.75 mM Fe-EDTA, 0.5mM NH4NO3, 2 μM H3BO3, 0.2 μM MnCl2, 0.19 μM ZnSO4, 0.01 μM CuSO4 and 0.03 μM H2MoO4. The concentration of six elements (Fe, Cu, Mn, Zn, B and Mo) was adjusted to 1/10-strength of standard solution to generate individual micronutrient starvation.
Growth analysis of bell pepper plants
Bell pepper plants from each treatment group were carefully taken between 10:00 and 12:00 to analyze growth rates (g·plant-1) at 5th and 15th days after the initiation of treatment. Harvested plants were firstly rinsed with deionized water and divided into shoots (leaves + stem) and roots. The weight of the shoots was measured after 48 hours-oven drying (80℃). Three biological replicates were taken for further analysis.
Sample preparation and analysis of polar metabolites
To examine metabolic changes by micro element starvation, the upper expanded leaves and roots at 15th day of the treatment were sampled, briefly rinsed with deionized water, immediately frozen in liquid nitrogen and stored at -80℃ prior to metabolite analysis. The extraction of polar metabolites was followed by Kim’s method (Kim et al., 2016). The powdered leaves and roots (0.1 g, FW) were homogenized with 1 mL of 2.5 : 1 : 1 (v/v/v) methanol : water : chloroform, and, as an internal standard (IS), ribitol (60 µL, 0.2 mg·mL-1) was used. The mixture was homogenized with 1,200 rpm at 37℃ for 30 min using a Thermomixer Compact (Eppendorf AG, Hamburg, Germany). The extracts were centrifuged at 16,000 × g for 3 min, the polar phase (0.8 mL) including 0.4 mL of distilled water was centrifuged at 16,000 × g for 3 min, dried in a centrifugal concentrator (CC-105, TOMY, Tokyo, Japan) for 2 h, and freeze-dried for 16 h. A methoxime (MO)-derivatization and trimethylsilyl (TMS)-esterification were carried out by shaking at 30℃ for 90 min after adding 80 μL of methoxyamine hydrochloride (20 mg·mL-1) in pyridine and by incubation at 37℃ for 30 min after adding 80 μL of N-Methyl-N-(trimethylsilyl) trifluoroacetamide (MSTFA), respectively.
GC-TOFMS was performed using an Agilent 7890A gas chromatograph (Agilent, Atlanta, GA, USA) coupled to a Pegasus HT-TOF mass spectrometer (LECO, St. Joseph, MI, USA). A sample (1 µL) was separated on a 30-cm × 0.25-mm I.D. fused-silica capillary column coated with 0.25-µm CP-SIL 8 CB low bleed (Varian Inc., Palo Alto, CA, USA). The split ratio was set to 1 : 25. The temperature of an injector was set up 230℃ and a flow rate of helium gas in the column was fixed with 1.0 mL·min-1. The temperature was set up as follows: initiation (80℃, 2 min) → increase (up to 320℃ with 15℃·min-1) → retention (320℃, 10 min). The transfer line and ion-source temperatures were 250 and 200℃, respectively. The scanned mass range was 85 - 600 m·z-1, and the detector voltage was set up 1,700 V. Chroma-TOF software was used to find the peak prior to a quantitative analysis and an automated deconvolution of the reference mass spectra. NIST (National Institute of Standards and Technology) and in-house libraries for standard chemicals were utilized for compound identification. The calculations used to quantify the concentrations of all analytes were based on the peak area ratios for each compound relative to the peak area of the IS.
Statistical analysis
Statistical analysis was performed using a SAS software (version 9.4, SAS Institute, Cary, NC, USA). Data were subjected to one-way ANOVA. If the ANOVA yielded a significant F value (p < 0.05), the differences among treatments were compared using Tukey’s range test. The relative quantification data acquired from GC-TOFMS were subjected to PCA (principal component analysis) (SIMCA-P version 13.0, Umetrics, Umeå, Sweden) to evaluate the relationships in terms of similarity or dissimilarity between groups of multivariate data (Kim et al., 2017). The PCA output consisted of score plots for visualizing the contrast between different samples and loading plots to explain the cluster separation. The data file was scaled with unit variance scaling before all variables were subjected to PCA. The Pearson’s correlation analysis and t-test were performed using the SAS 9.4 software package (SAS Institute, Cary, NC, USA). Correlation analysis among relative metabolite levels was performed using standardization pre-processing. HCA (hierarchical clustering analysis) and heatmap visualization of the correlation coefficient were performed using MultiExperiment Viewer software version 4.4.0 (http://www.tm4.org/mev/).
Results and Discussion
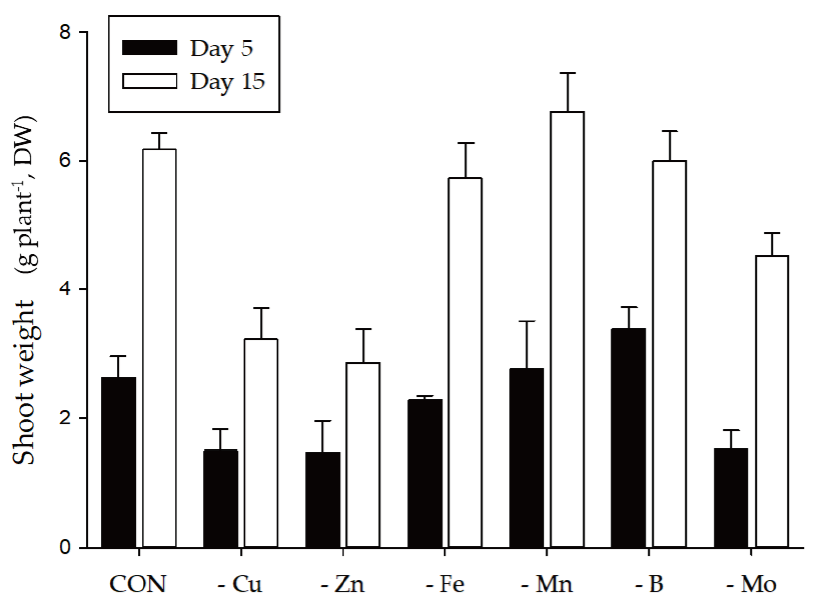
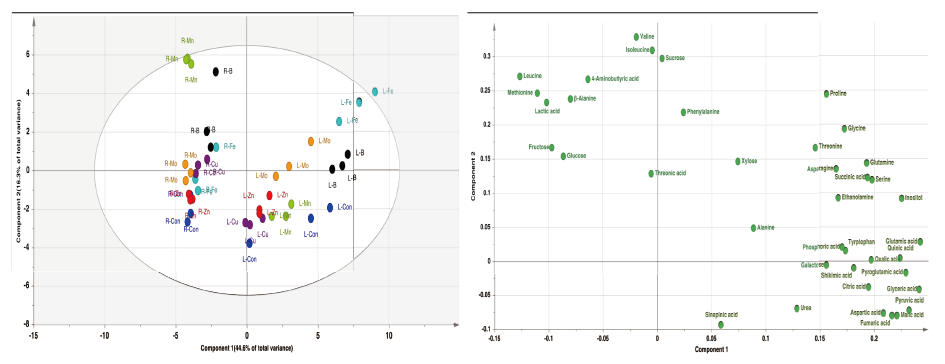
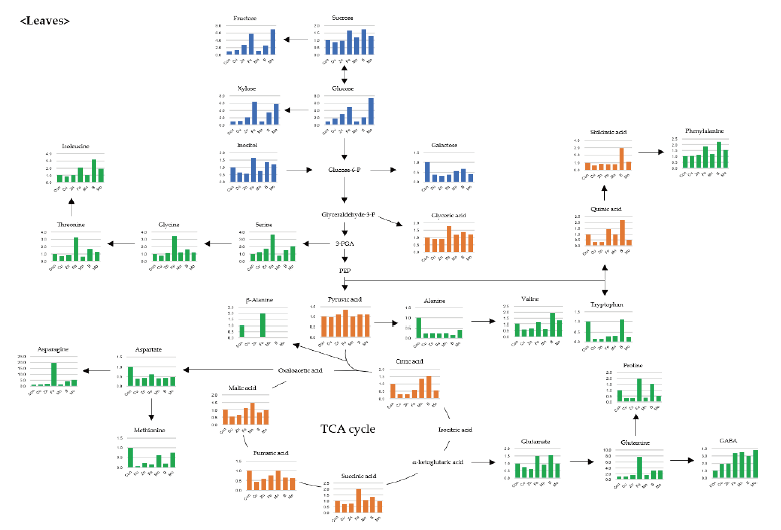
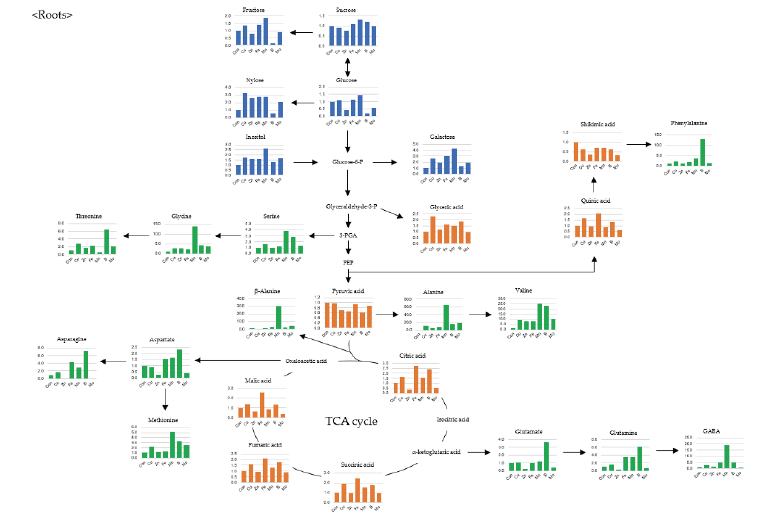
Shoot growth response of bell pepper plants were strongly dependent by the type of micro element (Fig. 1). Compared to the control (6.17 g·plant-1, DW) at 15th day, the relative growth rate was as follows; -Cu (52%, 3.22 g), -Zn (46, 2.85 g), -Fe (93, 5.73 g), -Mn (110, 6.77 g), -B (97, 6.00 g) and -Mo (73, 4.51 g). Under our experimental conditions, Cu, Zn or Mo starvation led to significant restriction in growth with an initiation of deficient condition whereas Fe, Mn or B didn’t represent such difference. Despite of the deficiency of same essential minerals, plant growth differed from plant species, strength and growth conditions; similar pattern in lupin and pokeweed by Cu, Zn and Mn limitations (Yu and Rengel, 1999; Zhao et al., 2012) and different trend in cabbage by B starvation (Sung, 2020). We reported that the deficiency of micro elements seemed to affect primary metabolite composition although growth limitation was not obvious (Sung, 2020). Using automated GC-TOFMS, 39 metabolites, including carbohydrates, amino acids, organic acids and others, which were detected and identified from the leaves and roots were used in subsequent analysis. Two methods, PCA and HCA, were applied, and both are broadly used for all identified metabolite data from the samples to compute an individual metabolic profile and simultaneously compare this profile with all other plant metabolic profiles. Metabolite data were subjected to PCA and major differences between control and micro elements-deficiency were identified using a PCA score plot (Fig. 2). The PCA revealed two principal components, PC1 and PC2 that explained 44.6 and 16.3% of the total variance, respectively (Fig. 2A). The first principal component resolved the organs, leaves and roots, and the second appeared a mixed separation of the type of minerals by leaves and roots. However, the leaves and roots of B deficient-plants were quite dissimilar from those of control. HCA showed two major clusters of metabolites (Fig. 3). All data from both leaves and roots are summarized in the form of a heat map to provide a comprehensive metabolite changes in response to the deficiency of micro elements. In general, the separation of carbohydrates (cluster I) from organic acids (cluster II) was noticeable due to the deficiency of micro elements. The heat map analysis could provide a powerful visualization of how metabolite levels alter in response to mineral deficiency. Therefore, the results from PCA and HCA revealed an interesting finding of how metabolites respond after an individual micro element deficiency. The relative fold changes in primary metabolites from the leaves and roots affected by the deficiency of micro elements were illustrated in Fig. 4 (leaves) and Fig. 5 (roots). As well documented (Van Assche and Clijsters, 1990; Jahangir et al., 2008; Atwood et al., 2013), microelements deficiency-derived effects are a direct limitation of photosynthesis, respiration and metabolic perturbation. Therefore, we describe some interesting findings to be taken from this study. Overall, metabolic responses in the leaves and roots differed from the type of microelements. Most noticeable changes in abundance of primary metabolites in the leaves were observed in the deficiency of Fe and B, and, in the roots, Mn and B. The restricted supply of Fe and B resulted in marked accumulation of a majority of carbohydrates and amino acids in the leaves. On the other hand, a limited Mn supply led to huge accumulation of carbohydrates and amino acids in the roots, however B responded differently by metabolites, decrease in carbohydrates and increase in amino acids. Considering these observations, the deficiency of microelements, particularly Fe, Mn and B, seemed to strongly influence the composition of carbohydrates and amino acids rather than organic acids. The levels of carbohydrates and amino acids increased markedly in the leaves in response to Fe deficiency (Fig. 4). Under Fe deficiency, it could be a possible explanation that the decreased activity of nitrogen assimilation enzymes such as nitrate and nitrite reductases (Borlotti et al., 2012) or an influx from the roots (Rellán-Álvarez et al., 2011) resulted in higher levels of carbohydrates. Moreover, lower levels of nitrate and amino acids in the xylem sap were an evidence that the increase in leaf amino acids was the result of proteolysis by leaf chlorosis and senescence by Fe deficiency (López-Millán et al., 2000; Rellán-Álvarez et al., 2011). Therefore, along with the increase in carbohydrates and amino acids, our observations are clearly in agreement with previous reports. Of amino acids, the huge increase in glutamine, asparagine and serine in both organs by Fe deficiency was noteworthy; glutamine (7.7- and 3.5-fold higher in the leaves and roots), asparagine (19.8- and 4.2-fold higher) and serine (3.6- and 1.2-fold higher). Glutamine and serine function to transfer amide group to other amino acids (Amtmann and Armengaud, 2009), and thus, considering that Fe deficiency induces restricted N assimilation which is a similar condition to low N, an accumulation of those amino acids is possible due to the limited amide transfer. Consequently, it is required to examine in detail the role of glutamine and asparagine, as a key amino acid of amino acid metabolism, under Fe deficiency. By contrast with Fe, Mn deficiency greatly affected the metabolism of carbohydrates and amino acids in the roots (Fig. 5). The levels of monosccharides, glucose, fructose, xylose and galactose, in the roots (sink) were highly elevated by Mn deficiency, and this is in line with the observations in young leaves (sink) of mulberry (Tewary et al., 2013) and in sink organ (Jhanji et al., 2015). Meanwhile, soluble carbohydrates in source organ were markedly reduced by Mn deficiency in wheat (Pearson and Rengel, 1997) and bean (Broadley et al., 2012). The opposite tendency, decrease in the leaves but increase in the roots, is assumed to be the cause of the impaired photosynthesis (leaves) and amino acid metabolism (roots). Surprisingly, Mn deficiency resulted in remarkable accumulation of several amino acids; serine (3.9-fold higher), glycine (13.9), β-alanine (29.9), alanine (65.3) and valine (24.7). Mn deficiency restricted the uptake and transport of nitrate, and inhibited enzyme activity of N assimilation and transamination (Gong et al., 2011), whereas there was no observation in amino acid accumulation caused by Mn deficiency. One of possible scenarios could be the accumulation of glycolysis intermediates-derived amino acids due to TCA cycle impairment, however more detailed study is required to support this hypothesis. Overall, B deficiency revealed a substantial perturbation in primary metabolism in terms of their relative levels in both organs compared to the control plants (Fig. 4 and Fig. 5). Soluble carbohydrates showed the trend of a slight increase in both organs by B deficiency except glucose and fructose, which were an opposite tendency in the leaves (2.2- and 2.5-fold) and roots (0.2- and 0.1-fold). Carbohydrates as a substrate for C-N metabolism and source-sink transportation led to a positive abundance in the leaves but a reduced concentration in the roots. Accumulation of carbohydrates in the leaves is considered as a frequently observed results by B deficiency in some plant species, cotton (Zhao and Oosterhuis, 2002), tobacco (Camacho-Cristóbal et al., 2004), sweet orange (Han et al., 2008; Han et al., 2009), and orange (Dong et al., 2016), and agree with our finding. Meanwhile, the significant reduction in glucose, fructose and xylose in the roots was observed, however, B deficiency did not affect the levels of carbohydrates (starch and soluble sugars) in the roots (Dong et al., 2016) or increased (Beato et al., 2014), in line with our findings. This decrease could be explained as the hexoses are rapidly incorporated into the oxidative pentose phosphate pathway and glycolysis (Marschner, 1995). A majority of amino acids represented a positive abundance in both organs. In particular, amino acids belonging to more than 10.0-fold were alanine (15.7-fold), valine (23.3-fold) and phenylalanine (13.0-fold) in the roots. Also, the levels of glutamine and asparagine showed an abundance of 3.1- and 4.3-fold in the leaves and 6.1- and 7.3-fold in the roots. The higher levels of amino acids in B-deficient roots might be attributed to limited protein biosynthesis (Alves et al., 2011) or cell damage (Koshiba et al., 2009). Our findings that the branched amino acids (alanine, valine and phenylalanine) were increased are supported by previous study (Kasajima et al., 2010), and this suggests that elevated levels of these amino acids due to B deficiency may be associated with cell damage or death. Moreover, higher phenylalanine level here could be attributed to the reduced production of secondary metabolism intermediates which act as substrates of cell wall synthesis (Dong et al., 2016; Sung, 2020). Glutamine and asparagine were also increased, suggesting elevated glutamate dehydrogenase (GDH) activity as a result of proteolysis due to B deficiency. The GDH triggers up-regulation of glutamine synthase (GS) and asparagine synthase (AS), which produce glutamine and asparagine, respectively (Beato et al., 2014). According to the levels of amino acids in both organs, increased amino acids due to B deficiency might be concluded as a result of proteolysis triggered by cell damage.
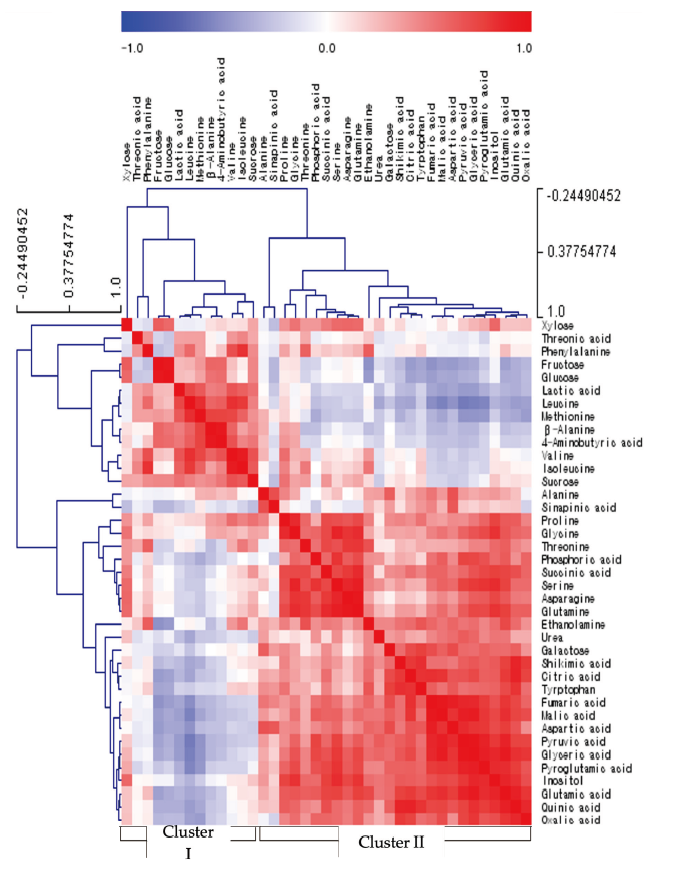
Fig. 3. Correlation matrix and cluster analysis of polar metabolites from the leaves and roots of bell pepper plants exposed to micronutrient deficiency for 15 days. Each square in the heatmap indicates the Pearson’s correlation coefficient for a pair of compounds. The value of the coefficient is represented by the intensity of the color (blue or red), as indicated on the color scale. Hierarchical clusters are represented in the cluster tree.
Conclusions
The present study obviously represents that primary metabolites, particularly carbohydrates and amino acids, are strongly affected by microelement deficiency in leaves and roots of bell pepper plants by employing a GC-TOFMS metabolite profiling approach. In particular, we focused on explaining the perturbation of carbohydrates and amino acids due to Fe-, Mn- and B-deficiency. Most noticeable changes in abundance of primary metabolites in the leaves were observed in the deficiency of Fe and B, and, in the roots, Mn and B. Fe deficiency markedly increased glucose, fructose, xylose, glutamine, asparagine and serine in the leaves. Mn deficiency also resulted in higher accumulation of metabolites in the roots; glucose, fructose, xylose, galactose, serine, glycine, β-alanine, alanine and valine. B deficiency highly accumulated alanine, valine and phenylalanine in the roots whereas extremely reduced the levels of glucose, fructose and xylose. The present study provides an evidence again which primary metabolism could be seriously disturbed by suboptimal microelement environments although the response is somewhat dependent upon the type of microelement. Accordingly, the deficiency of microelements restricted the usage of carbohydrates and accelerated protein degradation. On the basis of some findings obtained from the study, further experiments should focus on the specific pathway, carbohydrate interconversion, N assimilation and aminotransfer reaction, to better understand influences of microelement nutrition.


