Introduction
Organic farming has recently begun to draw attention worldwide in response to consumers becoming increasingly conscious about and sensitive to health and food safety issues. In South Korea, the organic milk market is experiencing strong growth as many consumers continuously prefer environmentally friendly, antibiotic, and all-natural high-quality milk from producers who are concerned about animal welfare. From 5 billion KRW in 2008, the net worth of the organic milk market was expected to grow to 100 billion in 2018 (USDA, 2018), resulting in the decreased consumption of regular milk. Regardless of the type of milk, the country’s annual consumption amounts to approximately 4.2 million tons as of 2018, of which 2 million tons were produced locally, and the other 2.2 million tons were imported Korea Dairy Committee (2017). This shows that dairy farming is a strong pillar in the food industry and a profitable farming sector in Korea. However, the profit from dairy farming has been decreasing due to the increased labor costs of dairy farming and increased import of less expensive dairy products. Furthermore, in 2018, the country experienced the hottest summer in 111 years, during which milk production decreased by more than 10% in August 2018 compared to that in August 2017 (USDA, 2018). With the intensification of hot periods due to climate change, dairy cows are subjected to increased heat stress. Heat stress, caused by high temperature and relative humidity, refers to the inability of dairy cows to efficiently dissipate their heat load. As reported by Lim and Ki (2019), heat stress changes the biological response of dairy cows such as skin and rectal temperature, and also alters the blood serum profile of dairy cows. In another study, Extended exposure to high ambient temperature and relative humidity compromises the ability of dairy cattle to dissipate heat, resulting in heat stress, which is associated with a reduction in milk yield (Novak, Vokralova, and Broucek 2009) and changes in milk composition and somatic cell counts (Rodriquez et al., 1985; Du Preez et al., 1990). Heat stress is evaluated in dairy production not just by temperature and relative humidity, but it is also assessed using the temperature-humidity index (THI), which integrates the two environmental conditions. Milk production, however, is not only affected by heat stress but also by farms and management practices (Liu et al., 2019). Although numerous studies have been conducted to understand the factors that affect dairy production, the findings are insufficient to elucidate the exact influences and interactions of these factors on milk production. Therefore, continuous efforts to understand the factors that affect milk quantity and quality are desirable to help mitigate the negative effects of ambient temperature and relative humidity on milk production. Hence, we aimed to evaluate the milk production and milk composition of conventional and organic milk under the same environmental conditions and the correlation of ambient temperature (Ta), relative humidity (RH), and THI with milk production parameters to determine which of two kinds of feeding (conventional or organic) is more likely susceptible to change based on environmental conditions.
Materials and Methods
Animal feeding and management
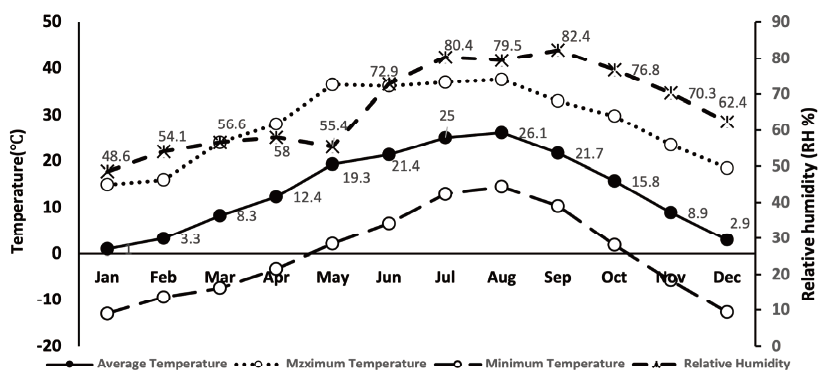
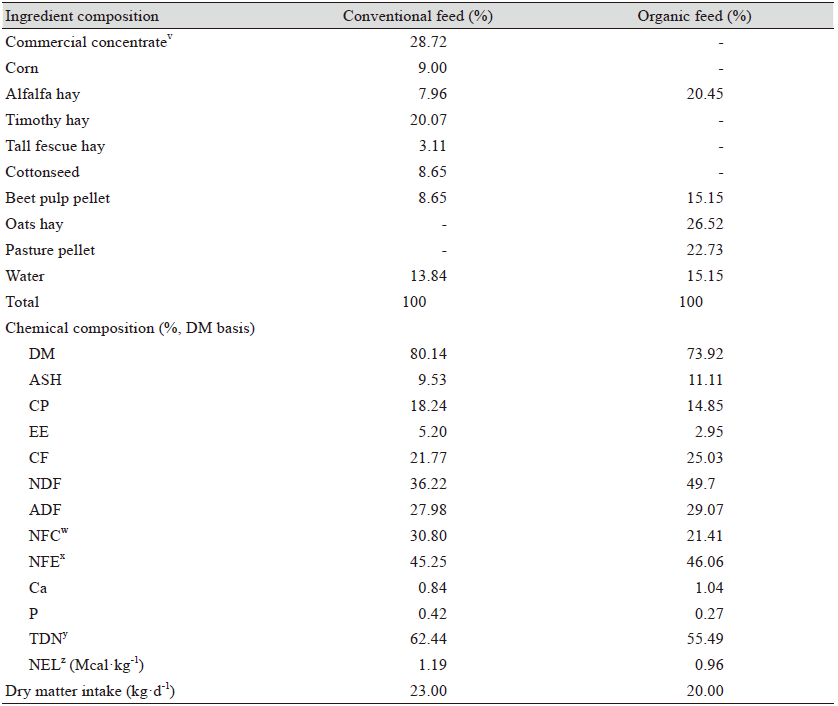
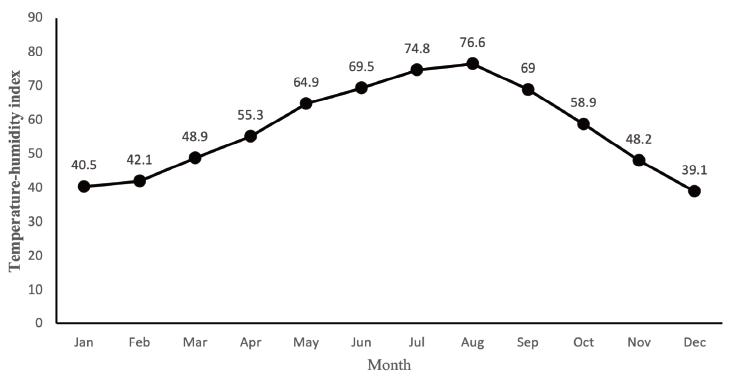
All experiments conducted in this study were conducted under the Animal Laboratory Ethics number CBNUA-1373-20-02. The experiment was conducted in Yechoen-gun, Sangju, Gyeongsangbuk-do, from April 2019 to November 2019 (mid-spring to late-autumn season). Environmental conditions such as temperature, RH, and THI values are shown in Fig. 1 and discussed in the Results and Discussion section. Prior to the experiment, the dairy cows were fed a total mixed ration (TMR) consisting of 50% grazed grass and 50% grass silage during the early lactation period (first three months) and were acclimatized to the experimental conditions for two weeks. A total of 50 mid-lactating Korean Holstein cows (144 - 150 days postpartum) were randomly assigned to two groups in equal numbers (n = 25) according to the type of diet received (conventional feed, a 56 : 44 ratio of roughage and concentrate mix, and organic feed containing 100% organic feed) and were housed in separate pens. As shown in Table 1, the conventional feed consisted of commercial concentrate, corn, alfalfa hay, timothy hay, tall fescue hay, cottonseed, and beet pulp pellets. Minerals and vitamins concerning the nutrient requirements for milk yield were also provided. The organic feed was composed of alfalfa hay, oat hay, beet pulp, and pasture pellets (Table 1). The strategy for organically feeding cows varies from country to country. In South Korea, organic feeding is managed by the Agricultural Products Quality Management Service. The organic feeding strategy in this experiment followed the standards of the “Act on the promotion of eco-friendly agriculture and fisheries and management support for organic food (abbreviation: Eco-Friendly Agriculture and Fishery Act)” in Korea.
The diets were mixed at the farm daily and given to the cows twice a day, in the morning (08:00) and in the evening (19:00). Roughage and concentrate samples were taken daily and composited into one sample per week and then averaged for one sample per month to analyze the chemical composition of dry matter (DM) (Table 1). The DM concentration of the diets was determined at 65℃ for 72 h. Crude protein (CP), ash, ether extract (EE), and crude fiber (CF) were determined according to the AOAC (1990). The neutral detergent fiber (NDF) and acid detergent fiber (ADF) contents were determined according to a previously described method (Goering and Van Soest, 1970). Total digestible nutrients (TDN) was estimated according to the formula created by Wardeh (1981): TDN (% of DM) = 40.32778 + 0.5398 (CP%) + 0.4448 (NFE%) + 1.4218 (EE%) - 0.7007 (CF%). Net energy lactation (NEL) was calculated as NEL (Mcal/kg) = 0.0245 × TDN (%) - 0.12 of beef cattle nutrient requirements (National council research 2001).
Ambient temperature (Ta) and RH were recorded daily. Daily maximum and minimum temperatures and RH were recorded in the housing pens using a maximum-minimum thermometer. THI values were calculated for the experimental period using the equation described by University of Missouri College of Agriculture Agricultural Experiment Station (1961): THI = 1.8 × Ta - (1 - RH) × (Ta -14.3) + 32, where Ta is the average ambient temperature in ℃, and RH is the average relative humidity as a fraction of the unit.
Milk sample collection and analysis
The cows were milked twice a day (04:00 and 16:00) in April, June, September, and November, and the milk yield was recorded at each milking on all sampling days for each cow. A weekly composite sample from the two milk samples was collected and stored in a conical tube, cooled, and then analyzed for milk composition (fat, protein, urea, lactose, and somatic cell count [SCC]) at the Hankyung university milk ingredient analysis center. The fat, protein, lactose, urea, and monounsaturated fatty acids (MUFAs), polyunsaturated fatty acids (PUFAs), saturated fatty acids (SFAs), and unsaturated fatty acids (UFAs) in milk were analyzed using a FOSS MilkoScan™ FT+ (Foss Electronic, Hilleroed, Denmark). The yield and fat percentage were used to calculate the 4% fat-corrected milk (FCM). The SCC of the milk samples were analyzed using Fossomatic™ FC (Foss Electronic, Hilleroed, Denmark).
Statistical analysis
Milk production data were analyzed during the mid- and late-lactation months of the dairy cows (mid-lactation period: April and June, late-lactation period: September and November). Statistical analysis of variance (ANOVA) was performed using Excel (ver. 2010, Microsoft Office, NY, USA) to analyze the statistical difference between treatments (conventional feed and organic feed) and experimental month (given the temperature and RH) on milk yield and components. Statistical differences were tested using Duncan’s multiple range test (DMRT) at p < 0.05. Correlation analysis was also performed using the Minitab statistical program (Minitab Inc., State College, PA, USA) to determine the correlation coefficients of temperature, RH, and THI on milk yield and milk components.
Results and Discussion
Milk yield and composition of conventional and organic milk
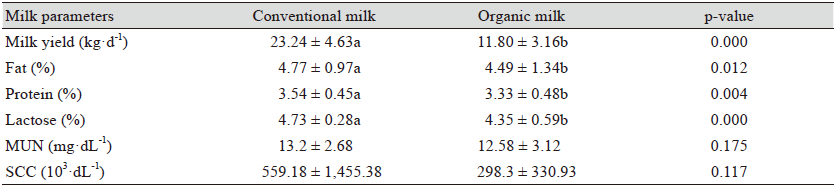
The ingredients and chemical composition of the conventional feed and organic feed are listed in Table 1. The organic feed showed an NDF content of 49.7%, which was higher than that of the conventional feed group (36.22%). This was expected, because the organic feed contained 100% roughage, whereas the conventional feed contained concentrate mix, which lowered the fiber content of the latter. In the study reported by Choi (Choi, 2018), dairy cows under heat stress showed lower DMI than the Korean feeding standard. The National Research Council (2001) recommends a minimum of 25 - 33% NDF content in the feed if the daily milk yield of the cows per milking stage is 25 - 54.5 kg. In this study, both the conventional and organic feed were above the minimum recommended requirement for dairy cows. The NDF content of feed and its digestibility could affect the feed intake, chewing activity, rumen pH, and milk production in dairy cows. As shown in Table 1, the dry matter intake (DMI) of the cows fed conventional feed and organic feed were 23 kg and 20 kg, respectively. The increased DMI of cows fed conventional feed in this study can be attributed to the improved NDF content of the feed, which might have improved the chewing activity of the cows, thereby improving the digestibility of the feed in the rumen, allowing the cows to consume more dry matter. In addition to the increased DMI, the cows fed conventional feed showed significantly higher milk yield at 23.24 kg·d-1 compared to the 11.80 kg·d-1 milk yield of organically fed cows (Table 2). This is consistent with previous findings (Hoffman and Bauman, 2003) in which cows fed forages with different NDF contents (45, 50, and 55%) had greater DMI and milk yield. The CP and TDN of the organic feed were 14.85% and 55.49%, respectively, which were lower than the 18.24% CP and 62.44% TDN of the conventional feed. The regulation of organic farming limits the use of supplements; therefore, a decreased content could be expected in organic feed. Supplementation of concentrates, especially starch-based, increases the protein synthesis rate in the mammary gland (Rius et al., 2010), and the interaction of dietary starch and CP affects milk and protein yield and concentration (Cabrita et al., 2007). Supplementation of the concentrate mix in the conventional feed could have improved the protein synthesis of the dairy cows; thus, their milk protein content was higher than that of cows fed with organic feed. The lower dietary CP content coupled with a lack of starch-based concentrate mix in the organic feed could explain the lower protein content of the organic milk (Table 2). In addition to milk and protein yield and concentration, the interaction between dietary starch and CP can also affect lactose content in milk (Rius et al., 2010). Higher non-fiber content (NFC) in the conventional feed (30.80%) than in the organic feed (21.41%) and higher CP likely contributed to the increased milk lactose content of the conventional milk (4.73%) compared to that of the organic milk (4.35%). Although changes in lactose content caused by dietary changes are less common, lactose content is positively related to milk yield (Shahbazkia et al., 2010) and milk protein (Bleck et al., 2008). Conventional feeding resulted in higher milk yield and milk protein compared to that from organic feeding, thereby increasing the lactose content in the conventional milk. Milk fat content was expected to be lower in the conventional milk than that in the organic milk because of the starch-based concentrates in the conventional feed in this study. Schwendel et al. (2015) stated that feeds with higher starch-based concentrates are commonly associated with decreased milk fat concentration. However, milk fat content was found to be higher in conventional milk (4.77%) than that in organic milk (4.49%) (p < 0.05), which could be due to the higher fat content (EE) in conventional feed than that in organic feed (5.20% and 2.95%, respectively). Diets enriched with fat supplements result in increased milk fat percentage in conventional milk. In this study, although the conventional feed had no added fat supplements, the feed contained higher EE than that of the organic feed, which might have contributed to the higher milk fat in the conventional milk. The milk fat content in the organic milk might also have been reduced by the low availability of fatty acids for absorption in the small intestine due to insufficient amounts of EE, CP, and TDN contents in the organic feed. There was no significant difference found regarding the milk urea nitrogen (MUN) of the two feeds, and the mean values of MUN in the conventional milk (13.20 mg·dL-1) and the organic milk (12.58 mg·dL-1) were within the MUN range reported in other studies, which ranged from 11 - 17 mg·dL-1 (Carlsson and Pehrson, 1994). MUN can be used as an approximate indicator of the amount of CP in the diets of dairy cows. The MUN results of this study indicate that CP content in the conventional and organic feeds contained a sufficient amount of protein required by dairy cows. Several published studies have found that conventional and organic milk are significantly comparable in terms of SCC (Müller-lindenlauf et al., 2010; Stiglbauer et al., 2013). Consistent with these reports, the SCCs of the conventional and organic milk in this study were statistically comparable, although the SCC of the conventional milk appeared to be higher.
Fatty acid composition of conventional and organic milk
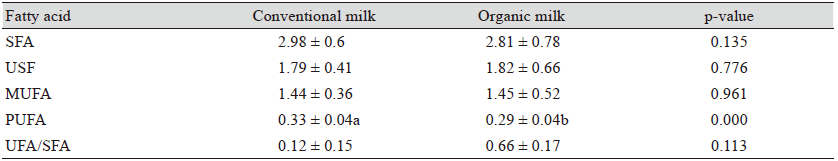
All fatty acids (SFA, USFA, MUFA, and USFA/SFA), except PUFA, were unaffected by the type of feed (Table 3). The total PUFA was significantly higher in the conventional milk (0.33%) than that in the organic milk (0.29%), contrary to the findings of Ellis et al. (2006), who reported that organic milk contained a higher proportion of PUFA compared to that in conventional milk. Butler et al. (2008) reported that the higher forage intake in organically fed cows compared to that in conventional cows accounts for the higher amount of PUFA in organic milk. The fatty acids in milk are most often affected by the microbial activity in the rumen of cows and the feed given to the cows (Parodi, 2004). Generally, low forage in the diet of cows or feeding of readily fermentable carbohydrates decreases the pH in the rumen, reduces fiber digestion, increases propionic acid, and decreases acetic and butyric acid production (FAO, 1980). This alteration in the proportion of the three major endogenous fatty acids due to the feed decreases milk fat content (Christie, 1979), and rumen fermentation activity could affect rumen biohydrogenation. Some of the many factors reported to affect the fatty acid composition in cow milk include cow breed (White et al., 2001), geographical location (Thorsdottir, Hill, and Ramel 2004), and season (Lock and Garnsworthy, 2003), which were all constant in the present study. Hence, the difference in the PUFA content could have been affected by the feed given. In this study, conventional milk contained higher PUFA content than that of organic milk, in contrast to the high PUFA contents reported in other studies (Jahreis et al., 1996; Bergamo et al., 2003). However, the present study presented the total PUFA, whereas referenced studies specifically reported the CLA content. There are few reports on the PUFA contents found in cow milk, as milk fatty acid synthesis is a complex process. In this study, the higher PUFA content in the conventional milk could be attributed to the more balanced and sufficient fiber content of the conventional feed, rendering it more easily digestible. In turn, this stabilizes the conditions of the rumen that are favorable for microorganisms that synthesize fatty acids or at least retain the PUFAs in the rumen for absorption in the small intestine. We can only draw an assumption on the fatty acid composition results of this study, because milk fatty acid composition can be influenced by various factors that need to be considered, such as animal genetics, individual cow management, organic regulations and standards, and agricultural practices.
Milk yield and composition of conventional and organic milk based on temperature and relative humidity
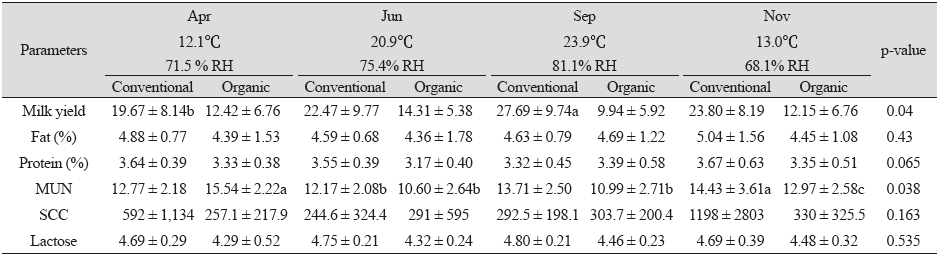
Temperature (average, maximum, and minimum temperature), RH, and THI values in Sangju, Gyeongbuk province in 2019 are summarized in Fig. 1 and Fig. 2, respectively. The temperature and RH in April, June, September, and November were 12.4℃ and 71.5% RH, 21.4℃ and 75.4% RH, 21.7℃ and 82.4% RH, and 8.9℃ and 68.1% RH, respectively. The high RH in June and September might be due to the rainy season. The highest THI values were recorded in August and July (76.6 and 74.8), followed by June (69.5). Milk yield and composition of the cows fed conventional and organic feed according to the temperature and RH at different months are shown in Table 4, and the correlation between environmental conditions and milk production and composition are shown in Table 5. The milk yield of the cows fed conventional feed was significantly highest in September (27.69 kg) and lowest in April, whereas the milk yield of the cows fed organic feed was highest in June (14.31 kg) and lowest in September (9.94 kg). The cows did not experience thermal stress in September, during which the temperature was 21.7℃, resulting in increased milk yield. High-performance cows are only subjected to thermal stress when the temperature rises above 27℃ under dry conditions (Webster, 1983; West, 2003).
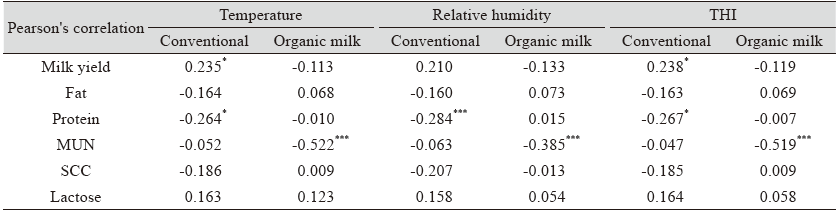
The milk yield of the conventionally fed cows was significantly correlated with the temperature at r = 0.023 (p < 0.05) and THI at r = 0.238 (p < 0.05), whereas there was no significant correlation found between the temperature, RH, or THI value and the organic feed. The positive correlations of temperature and THI with conventional milk yield in this study indicate that milk yield increases with increasing temperature and THI, contrary to the findings of other studies that reported that increased heat stress leads to a reduction in milk production in dairy cows due to a decrease in feed intake (Ravagnolo et al., 2000; Ammer et al., 2018). It should be noted that the highest THI value recorded during the experimental period was in June at 69.5, which is less than the THI value of 72, the point where cows normally experience mild heat stress (Armstrong, 1994). Cows receiving conventional feed in September under the environmental conditions of 21.7℃, 82.4% RH, and a THI value of 69.0 produced higher milk yield than that of cows that received an organic feed.
There were no significant differences between the months for all milk composition parameters, such as milk fat, milk protein, lactose, and SCC, with the exception of the MUN (Table 4). The MUN content was highest in April (15.54 mg·dL-1) in organically fed cows, whereas the MUN content was highest in November (14.43 mg·dL-1) in conventionally fed cows. This result was similar to those of Doska et al. (2012), in which the MUN was highest during the winter season and moderately high during the spring at 15.88 mg·dL-1, and contrary to the findings of Carlsson and Pehrson (1994), who reported that the MUN in milk increased during the summer period. During summer, farmers tend to increase the protein content of the cows' diets to compensate for their lower nutrient consumption, because DM intake of dairy cows normally decreases with increasing temperature. In this study, dairy cows were fed the same diet throughout the experimental period. In addition, the high MUN content in this study during the moderately cold season (April [spring] and November [fall]) may be due to the seasonal protein-rich roughages. Spring roughages, although poor in soluble carbohydrates, are rich in proteins (greater than 20% CP) (Moller, Matthew, and Wilson 1993). Despite the significant effect of the month on the MUN of conventional milk, environmental conditions did not appear to be correlated with MUN. On the other hand, the correlation results showed that in organic feed, the MUN was negatively correlated with the temperature at r = -0.522 (p < 0.001), indicating that MUN content decreases with increasing temperature. This study suggests that in organic feeding, dairy cows require higher levels of dietary protein at low temperatures.
Milk fat, milk protein, MUN, and SCC all decreased with increasing temperature; however, the correlation result showed that only milk protein (r = -0.264) was statistically correlated with temperature in the conventional feed (p < 0.05) (Table 5). As the outside temperature increases, feed intake decreases, and microbial protein synthesis in the rumen decreases, resulting in a decrease in milk protein content (Godden et al., 2001). RH did not appear to directly affect the milk components of the conventional and organic milk. Significant correlation coefficients were only observed between RH and milk protein at r = -0.284 (p < 0.001) in conventional milk and MUN at r = -0.385 (p < 0.001) in organic milk (Table 5).
The THI is most often used as an environmental index to evaluate heat stress in dairy production (Bohmanova et al., 2007; Ammer et al., 2018). Armstrong (1994) demonstrated that cows do not experience heat stress with THI values less than 72, experience mild heat stress when THI values are at 73 - 79, suffer moderate heat stress when THI is at 80 - 89, and exhibit severe heat stress when THI is higher than 90. In this study, the highest THI value was observed in June at 69.5 (Fig. 2), which is less than the THI value of 72 where cows normally experience mild heat stress. In conventional milk, milk fat (r = -0.163), milk protein (r = -0.267), MUN (r = -0.047), and SCC (r = -0.185) were all negatively correlated with THI, but only milk yield (r = 0.238) and milk protein (r = -0.267) were statistically correlated (p < 0.05) (Table 5). The positive correlation between THI and milk yield contrasts with the findings of Bouraoui et al. (2002). Milk production is reduced due to decreased feed intake when cows experience heat stress (Ravagnolo, Misztal, and Hoogenboom 2000). In this study, THI values were below the minimum THI where cows normally experience heat stress; therefore, it could be inferred that the milk yield in conventional feeding showed a statistically positive correlation with THI. Lactose is closely related to milk yield; thus, a positive correlation between lactose and THI was expected. In the organic feed, milk yield (r = -0.119), milk protein (r = -0.007), and MUN (r= -0.519) were negatively correlated, but only MUN showed a significant correlation with THI (p < 0.001). Milk fat (r = 0.069), SCC (r = 0.009), and lactose (r = 0.058) of organic milk were positively but not significantly correlated with THI. Throughout the experiment, milk yield, fat, protein, and lactose levels were significantly higher in conventional milk than those in organic milk. However, cows fed conventional feed were affected more by environmental conditions such as temperature, RH, and THI compared to cows fed organic feed. Organic feed, which mainly contained roughage, resulted in a lower milk yield, but it was less likely to be affected by environmental factors.
Competing Interests
The authors declare that there are no competing financial or personal interests that might have influenced the results of the work described in this manuscript.
Acknowledgments
This work was supported by the Technology development Program(S2851626) funded by the Ministry of SMEs and Startups (MSS, Korea).
Author’s Contributions
Conceptualization was made by SH Choi. Data curation was conducted by JG Joo and KMC Nogoy Methodology was conducted by JG Joo, HD Kang, HG Hong, YG Song, S Li, J Yu, and formal and data analysis was done by JG Joo and KMC Nogoy. Analyses were validated by JW Chung, DH Lee, and SH Choi. Writing of the original draft was made by JG Joo and KMC Nogoy, and was reviewed and edited by JW Chung, DH Lee, and SH Choi.
Ethics Approval and Consent to Participate
All experimental works conducted in this study were carried out using the Animal Laboratory Ethics number CBNUA-1373-20-02.
Authors Information
Jong Gwan Joo, https://orcid.org/0000-0002-8749-9048
Kim Margarette C. Nogoy, https://orcid.org/0000-0002-0958-7632
Jihwan Park, https://orcid.org/0000-0002-7982-5966
Sunil Chon, https://orcid.org/0000-0002-5998-6869
Dong Hoon Lee, https://orcid.org/0000-0002-0582-1890
Seong Ho Choi, https://orcid.org/0000-0001-8869-0218